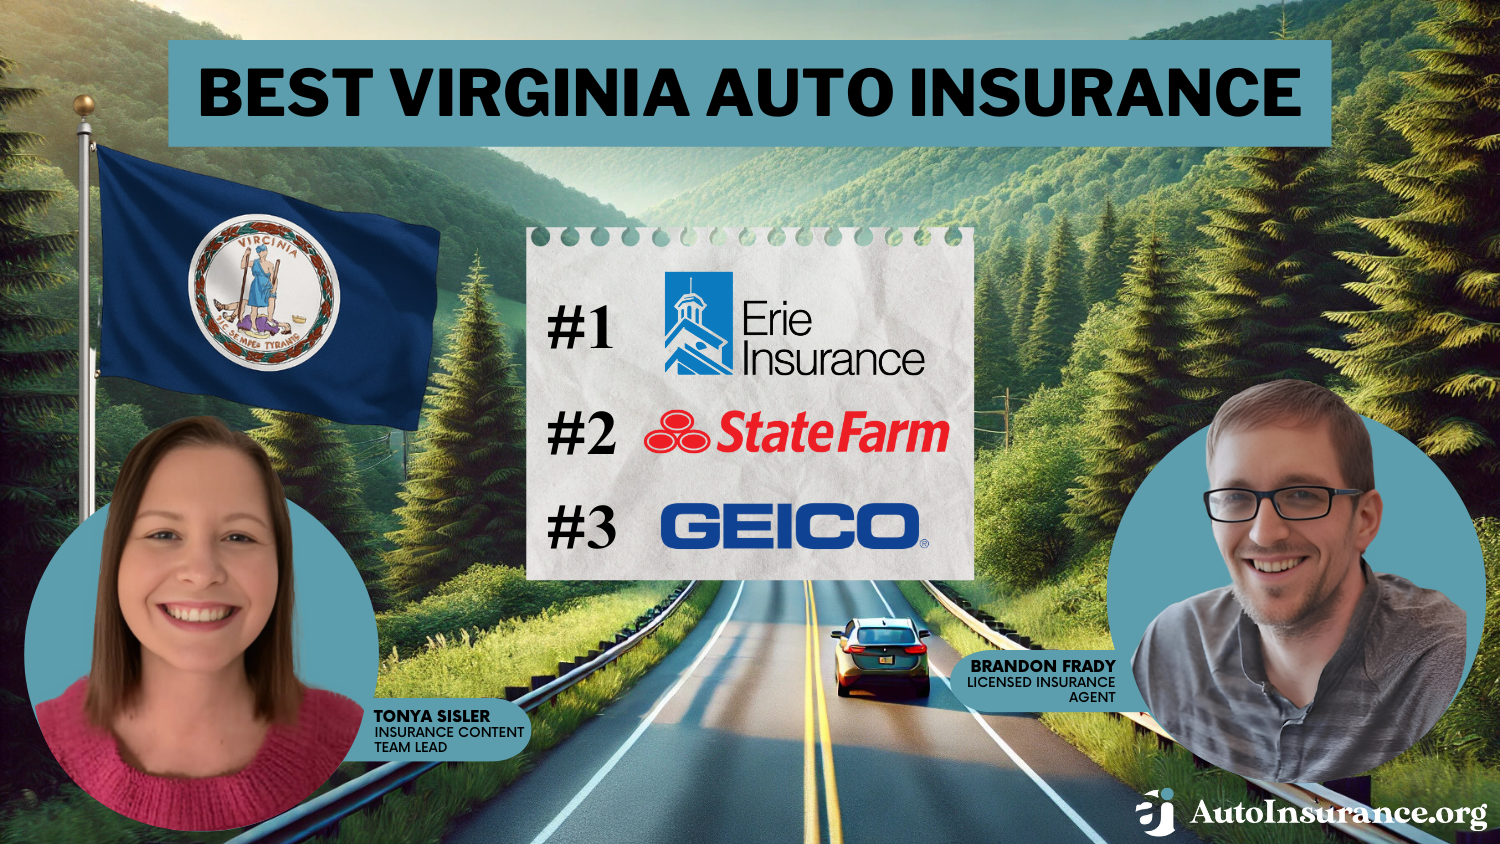
Virginia Auto Insurance [Rates + Cheap Coverage Guide]
Virginia requires a minimum of 25/50/20 for bodily injury and property damage coverage. Virginia residents enjoy auto insurance rates below the U.S average.
Free Car Insurance Comparison
Compare Quotes From Top Companies and Save
Secured with SHA-256 Encryption
Free Car Insurance Comparison
Compare Quotes From Top Companies and Save
Secured with SHA-256 Encryption
UPDATED: Apr 29, 2022
It’s all about you. We want to help you make the right coverage choices.
Advertiser Disclosure: We strive to help you make confident auto insurance decisions. Comparison shopping should be easy. We are not affiliated with any one auto insurance provider and cannot guarantee quotes from any single provider. Our partnerships don’t influence our content. Our opinions are our own. To compare quotes from many different companies please enter your ZIP code on this page to use the free quote tool. The more quotes you compare, the more chances to save.
On This Page
Virginia Statistics Summary | Details |
---|---|
Road Miles | 75,061 |
Registered Vehicles | 7,046,065 |
State Population | 8,517,685 |
Most Popular Vehicle | CR-V |
Uninsured Drivers | 9.90% Rank: 34th |
Total Traffic Related Fatalities (2008 to 2017) | Speeding: 2,031 DUI: 2,316 |
Average Premiums | Liability: $425.61 Collision: $280.52 Comprehensive: $136.54 |
Cheapest Provider | USAA |
Get Your Rates Quote Now |
As one of the original 13 states, Virginia is a state bursting with fascinating historical landmarks. People can visit George Washington’s famous plantation, stroll through the iconic Jamestown museum, or see the start of the Appalachian Trail.
For those who live in Virginia, though, there is the necessary chore of purchasing auto insurance, which is a lot less interesting. Scrolling through dozens of websites and reviews sometimes feels like a waste of time.
But it doesn’t have to be. Imagine having all the necessary information compiled for you, from insurance requirements to company reviews, from road rules to crash stats.
That’s where we come in. Our comprehensive guide covers what to know when buying auto insurance and driving in the state of Virginia. So let’s jump right into it.
Want to start comparison shopping today? Enter your ZIP code above in our FREE online tool!
Table of Contents
Virginia Auto Insurance Coverage and Rates
With multiple coverages and rate options available, it can be tough to know what you should be purchasing. While it can be tempting to skip out on coverages to save money, this could cost you in the long run.
That’s why we are going to cover what you NEED and what you SHOULD have. Virginia requires drivers to have certain coverages and having other coverage options is just common sense.
So keep reading to learn about Virginia’s coverages and rates, so that you can get the most recommended auto insurance coverage.
Virginia Minimum Coverage
Virginia requires more complete coverage than other states, though drivers may opt out of insurance if they wish. Drivers in Virginia must have bodily injury and property damage liability coverage, as well as uninsured and underinsured motorist coverage. These coverages are the state minimums for car insurance in Virginia.
If you choose to not have these coverages, you will have to pay the $500 Uninsured Motor Vehicle (UMV) fee every year. You will still be held liable in accidents, and you drive at your own risk.
The smartest option is to carry Virginia’s minimum insurance amounts. The Insurance Information Institute (iii) lists the minimum required amounts as the following.
- 25,000 to cover bodily injury costs per person in an accident for which you are at fault
- 50,000 to cover total bodily injury costs per accident for which you are at fault
- 20,000 to cover property damages in an accident for which you are at fault
Driver’s must also have uninsured and underinsured coverage, though minimum amounts are not specified. Not having Virginia’s required coverages without paying the UMV fee is illegal and will result in the suspension of your license and registration.
Forms of Financial Responsibility
So how do you prove that you are following Virginia’s auto insurance law? Virginia requires that all drivers have a form of financial responsibility, which is simply proof of auto insurance.
Below are some acceptable forms of financial responsibility in Virginia.
- Valid Insurance ID Card
- Proof that you paid the UMV fee
Even though drivers may drive uninsured in Virginia, uninsured drivers still need to prove they are following Virginia’s UMV law. Anytime drivers are pulled over in a traffic stop, register a car, or are in an accident, they must provide proof of financial responsibility.
Virginia also has an electronic verification system to check vehicles’ insurance status.
Premiums as a Percentage of Income
In order to see how much coverage takes out of an average income, we are going to take a look at Virginia’s per capita disposable income and premiums.
Per captita disposible income is simply how much a person has to spend or save after taxes.
The table below shows how much the average Virginian pays each year for auto insurance. Luckily, Virginia’s percentages are below the countrywide average, which is about 2.4 percent.
Virginia Premiums as Percentage of Income | 2012 | 2013 | 2014 |
---|---|---|---|
Full Coverage | $781.38 | $809.40 | $836.14 |
Disposable Income | $43,685.00 | $42,474.00 | $43,904.00 |
Insurance as % of Income | 1.79% | 1.91% | 1.90% |
Get Your Rates Quote Now |
Virginia’s percentages have remained steady throughout the years. Even though the cost of premiums went up, the disposable income also increased. The good news, too, is that Virginia’s percentages are lower than most.
The highest percentage in the U.S. is almost four percent, whereas the lowest percentage is just above one percent. Since Virginia is firmly in between the lowest and highest percentages, it has a fairly decent percentage (though lower is always better).
Average Monthly Auto Insurance Rates in VA (Liability, Collision, Comprehensive)
Core coverage has some of the most valuable coverages in case of an accident. While Virginia requires liability, other great core coverages are a collision or comprehensive coverage.
- Collision coverage will help pay for repairs or replacement if your car is damaged because of a collision with another vehicle or object.
- Comprehensive coverage will help pay for repairs or replacement if your car is damaged by something OTHER than a collision. For example, natural disasters (fire, hail, etc.), theft, vandalism, or hitting an animal.
To see how much these coverages cost, we’ve compiled the average annual rates below.
Coverage Type | Annual Costs (2015) |
---|---|
Liability | $425.61 |
Collision | $280.52 |
Comprehensive | $136.54 |
Combined | $842.67 |
Get Your Rates Quote Now |
Virginia’s averages are actually below the countrywide averages. The combined countrywide average is $1,009, which means Virginia residents pay $167 less than most people in the U.S.!
Additional Liability
Additional liability coverages are important to have. Two of the biggest additional liability coverages are medical payments (Medpay) and uninsured/underinsured coverages.
With 9.9 percent of drivers uninsured in Virginia (ranking the state as 34th in the U.S. for uninsured drivers), uninsured and underinsured coverage is necessary to protect drivers.
If you are in an accident with uninsured/underinsured drivers and they are at fault, you risk having to pay the accident bills yourself. Most uninsured/underinsured drivers will go bankrupt before being able to pay off the accident costs.
You may remember that Virginia requires uninsured and underinsured coverage unless you opt of insurance coverage, but Medpay is optional. Medpay is still a great coverage to have, as Medpay covers both your medical costs and your passengers’ medical costs from an accident.
Up next, we have the National Association of Insurance Commissioner’s (NAIC) data on these coverages’ loss ratios.
Why should you care about loss ratios? Loss ratios show how well a company is doing financially.
Companies who are paying out too many claims have loss ratios over 100 percent and risk going bankrupt. On the other hand, companies who aren’t paying out enough claims have low loss ratios and risk losing customers.
With this in mind, let’s take a look at the additional coverages’ loss ratios.
Additional Liability Coverage in Virginia - Loss Ratios | 2013 | 2014 | 2015 |
---|---|---|---|
Medical Pay (Med Pay) | 76.96% | 69.13% | 67.12% |
Uninsured/Underinsured Motorist Coverage | 69.58% | 72.95% | 74.89% |
Get Your Rates Quote Now |
Unfortunately, Medpay’s loss ratios have dipped over the years and are below the countrywide average of 75 percent. As for the uninsured and underinsured loss ratios, they have risen over the years to match the countrywide average (which is about 74 percent).
The good news is that none of the loss ratios are terribly low or too high, meaning these coverages are functioning well.
Add-Ons, Endorsements, and Riders
Add-ons may seem excessive to you if you are already purchasing Virginia’s required amount. While these extra coverages are optional, they are affordable and allow you to create a tailored protection plan, making them well worth your money.
Below is a list of the most popular add-ons.
- Guaranteed Auto Protection (GAP)
- Personal Umbrella Policy (PUP)
- Rental Reimbursement
- Emergency Roadside Assistance
- Mechanical Breakdown Insurance
- Non-Owner Auto Insurance
- Modified Auto Insurance Coverage
- Classic Auto Insurance
- Low-Mileage Discount
Any of the above coverages would make great add-ons to policies.
Average Auto Insurance Rates by Age & Gender in VA
The most common demographics that impact rates are gender and age, though marital status and other demographics can also influence rates. We partnered with Quadrant to bring you the following information on rate changes influenced by everything from demographics to cities.
Company | Married 35-year old female Annual Rate | Married 35-year old male Annual Rate | Married 60-year old female Annual Rate | Married 60-year old male Annual Rate | Single 25-year old female Annual Rate | Single 25-year old male Annual Rate | Single 17-year old female Annual Rate | Single 17-year old male Annual Rate |
---|---|---|---|---|---|---|---|---|
Allstate P&C | $2,042.71 | $1,927.39 | $2,031.96 | $2,031.96 | $2,657.43 | $2,658.75 | $6,396.46 | $7,347.87 |
Geico General | $1,474.02 | $1,470.60 | $1,398.20 | $1,398.20 | $1,714.05 | $1,694.63 | $3,138.15 | $4,204.21 |
Nationwide P&C | $1,434.40 | $1,443.10 | $1,272.72 | $1,307.89 | $1,582.01 | $1,722.41 | $3,416.59 | $4,404.98 |
Progressive Advanced | $1,253.97 | $1,191.17 | $1,132.78 | $1,136.43 | $1,518.75 | $1,551.92 | $5,745.36 | $6,458.02 |
State Farm Mutual Auto | $1,391.16 | $1,391.16 | $1,254.98 | $1,254.98 | $1,572.89 | $1,810.26 | $4,201.32 | $5,274.60 |
USAA | $1,116.18 | $1,099.39 | $1,043.95 | $1,050.74 | $1,436.42 | $1,578.62 | $3,443.74 | $4,098.09 |
Get Your Rates Quote Now |
Teenage males have the highest rates at Virginia’s insurers, paying thousands more than other age groups. Teenage females also have higher rates, though generally, they pay about a thousand less than teenage males in Virginia.
These higher rates make sense, as teenage drivers are higher-risk due to lack of experience. Because the rates are so high, though, most parents will add their teenagers onto the parents’ policy where the raised rates are much more reasonable. The good news is that while Virginia’s rates are high, the state’s teenage rates are still lower than average because Virginia is one of the best states for cheap teen auto insurance.
Curious what other demographics have increased rates? Check out the complete list of demographics below to see what your rates might be.
Companies | Married 60-year-old female | Married 60-year-old male | Married 35-year-old female | Married 35-year-old male | Single 25-year-old female | Single 25-year-old male | Single 17-year-old female | Single 17-year-old male |
---|---|---|---|---|---|---|---|---|
USAA | $1,043.95 | $1,050.74 | $1,116.18 | $1,099.39 | $1,436.42 | $1,578.62 | $3,443.74 | $4,098.09 |
Progressive | $1,132.78 | $1,136.43 | $1,253.97 | $1,191.17 | $1,518.75 | $1,551.92 | $5,745.36 | $6,458.02 |
State Farm | $1,254.98 | $1,254.98 | $1,391.16 | $1,391.16 | $1,572.89 | $1,810.26 | $4,201.32 | $5,274.60 |
Nationwide | $1,272.72 | $1,307.89 | $1,434.40 | $1,443.10 | $1,582.01 | $1,722.41 | $3,416.59 | $4,404.98 |
Geico | $1,398.20 | $1,398.20 | $1,474.02 | $1,470.60 | $1,714.05 | $1,694.63 | $3,138.15 | $4,204.21 |
Allstate | $2,031.96 | $2,031.96 | $2,042.71 | $1,927.39 | $2,657.43 | $2,658.75 | $6,396.46 | $7,347.87 |
Get Your Rates Quote Now |
Married 60-year-olds and married 35-year-olds consistently have the lowest rates at most providers.
Cheapest Rates by ZIP Code
Another factor that impacts rates is where you live. Insurers may charge more in areas with a higher crime rate or areas with more traffic congestion that carry higher risks of a crash.
We’ve also included Quadrant’s data on the cheapest providers in your ZIP code in the tables below.
Cheapest ZIP Codes in Virginia | City | Average Annual Rate by ZIP Codes |
---|---|---|
24450 | LEXINGTON | $2,018.13 |
22802 | HARRISONBURG | $2,031.22 |
24401 | STAUNTON | $2,033.51 |
22815 | BROADWAY | $2,034.01 |
24060 | BLACKSBURG | $2,035.11 |
22840 | MC GAHEYSVILLE | $2,036.30 |
22834 | LINVILLE | $2,037.09 |
22853 | TIMBERVILLE | $2,038.95 |
24416 | BUENA VISTA | $2,039.40 |
22833 | LACEY SPRING | $2,041.03 |
24073 | CHRISTIANSBURG | $2,042.79 |
22812 | BRIDGEWATER | $2,043.31 |
22801 | HARRISONBURG | $2,044.17 |
22939 | FISHERSVILLE | $2,044.69 |
24471 | PORT REPUBLIC | $2,046.56 |
22821 | DAYTON | $2,046.69 |
22841 | MOUNT CRAWFORD | $2,048.17 |
22830 | FULKS RUN | $2,048.95 |
22848 | PLEASANT VALLEY | $2,049.22 |
22803 | HARRISONBURG | $2,050.19 |
24141 | RADFORD | $2,050.57 |
22811 | BERGTON | $2,050.97 |
24435 | FAIRFIELD | $2,053.78 |
24486 | WEYERS CAVE | $2,055.76 |
22824 | EDINBURG | $2,056.80 |
Get Your Rates Quote Now |
Between the most and least expensive ZIP codes, there is only an $853 difference. This may seem like a lot, but other states can have ZIP code increases in the thousands.
Most Expensive ZIP Codes in Virginia | City | Average Annual Rate by ZIP Code |
---|---|---|
22312 | ALEXANDRIA | $2,871.02 |
22041 | FALLS CHURCH | $2,857.11 |
22151 | SPRINGFIELD | $2,855.79 |
22311 | ALEXANDRIA | $2,838.20 |
22003 | ANNANDALE | $2,834.25 |
22150 | SPRINGFIELD | $2,816.60 |
22309 | ALEXANDRIA | $2,806.21 |
23222 | RICHMOND | $2,800.69 |
22153 | SPRINGFIELD | $2,797.16 |
22060 | FORT BELVOIR | $2,794.01 |
22306 | ALEXANDRIA | $2,788.85 |
22079 | LORTON | $2,786.19 |
22044 | FALLS CHURCH | $2,777.26 |
22081 | MERRIFIELD | $2,776.35 |
22015 | BURKE | $2,773.79 |
22103 | WEST MCLEAN | $2,771.74 |
22304 | ALEXANDRIA | $2,762.26 |
22152 | SPRINGFIELD | $2,751.29 |
22310 | ALEXANDRIA | $2,751.15 |
23223 | RICHMOND | $2,748.67 |
23224 | RICHMOND | $2,747.43 |
22039 | FAIRFAX STATION | $2,744.30 |
22191 | WOODBRIDGE | $2,741.58 |
22204 | ARLINGTON | $2,741.36 |
22026 | DUMFRIES | $2,739.74 |
Get Your Rates Quote Now |
Cheapest Rates by City
Similar to ZIP codes, cities also show increases and decreases in price. Check the tables below to see rates in your city.
Cheapest Cities in Virginia | Average Annual Rate by City |
---|---|
East Lexington | $2,018.13 |
Broadway | $2,034.01 |
Blacksburg | $2,035.11 |
Massanutten | $2,036.30 |
Linville | $2,037.09 |
Timberville | $2,038.95 |
Fishersville | $2,039.10 |
Buena Vista | $2,039.40 |
Lacey Spring | $2,041.03 |
Christiansburg | $2,042.79 |
Bridgewater | $2,043.31 |
Port Republic | $2,046.56 |
Dayton | $2,046.69 |
Mount Crawford | $2,048.17 |
Fulks Run | $2,048.95 |
Pleasant Valley | $2,049.22 |
Belview | $2,050.57 |
Bergton | $2,050.97 |
Harrisonburg | $2,053.51 |
Fairfield | $2,053.78 |
Weyers Cave | $2,055.76 |
Edinburg | $2,056.80 |
Mount Sidney | $2,057.62 |
Woodstock | $2,057.97 |
Stuarts Draft | $2,058.53 |
Get Your Rates Quote Now |
Annandale and Springfield are the most expensive cities, but like ZIP code rate changes, these cities are only $816 more than the cheapest cities. This means that the insurance rate increases shouldn’t be a huge concern when moving to Virginia.
Most Expensive Cities in Virginia | Average Annual Rate by City |
---|---|
Bailey's Crossroads | $2,857.10 |
Kings Park | $2,855.78 |
Springfield | $2,816.60 |
Mount Vernon | $2,806.21 |
Fort Belvoir | $2,794.01 |
Annandale | $2,778.14 |
Merrifield | $2,776.35 |
East Highland Park | $2,774.68 |
Burke | $2,774.08 |
West Mclean | $2,771.74 |
Crosspointe | $2,765.25 |
Cherry Hill | $2,740.66 |
Franconia | $2,739.44 |
Fleet | $2,738.46 |
Dumfries | $2,733.77 |
Dale City | $2,730.84 |
Huntington | $2,730.54 |
Triangle | $2,705.49 |
Alexandria | $2,696.83 |
Fort Hunt | $2,695.93 |
County Center | $2,689.81 |
Fairfax | $2,689.31 |
Great Falls | $2,686.17 |
Fair Lakes | $2,680.83 |
Greenway | $2,677.88 |
Get Your Rates Quote Now |
Free Auto Insurance Comparison
Enter your ZIP code below to view companies that have cheap auto insurance rates.
Secured with SHA-256 Encryption
Best Virginia Auto Insurance Companies
Finding the right auto insurance is hard! With over seven million cars needing insurance in Virginia, auto insurance companies are numerous. How do you know which insurance company is right for you?
Luckily, we’ve done the hard work of sorting through companies for you so that you can find the company with the perfect rates and coverages for your needs!
Up next, we cover everything from companies’ financial ratings to changes in rates.
The Largest Companies’ Financial Ratings
If you recall, loss ratios play a large part in how secure a company is doing financially. That’s why we want to include AM Best’s ratings, which look at loss ratios to determine if a company has solid financial security.
The basic ratings AM Best gives are explained below.
- A++ and A+ have a superior ability to meet financial obligations
- A and A- have an excellent ability to meet financial obligations
- B++ and B+ have a good ability to meet financial obligations
Any company with a rating lower than a B+ should be avoided. Companies with lower AM Best ratings don’t have great financial security, meaning they may not pay out enough claims or face going bankrupt if economic conditions change in the future.
So to see how the 10 largest companies in Virginia are faring, we’ve included the AM Best ratings for each.
Company | AM Best Rating | Direct Premiums Written | Loss Ratio | Market Share |
---|---|---|---|---|
Geico | A++ | $979,950 | 71.20% | 18.04% |
USAA Group | A++ | $717,325 | 74.59% | 13.21% |
Travelers Group | A++ | $120,565 | 60.00% | 2.22% |
Allstate Insurance Group | A+ | $523,325 | 54.37% | 9.64% |
Progressive Group | A+ | $492,052 | 64.82% | 9.06% |
Nationwide Corp Group | A+ | $426,052 | 59.34% | 7.85% |
Erie Insurance Group | A+ | $205,964 | 69.19% | 3.79% |
State Farm Group | A | $923,989 | 66.23% | 17.01% |
Liberty Mutual Group | A | $154,405 | 55.65% | 2.84% |
Virginia Farm Bureau Group | A- | $115,612 | 59.08% | 2.13% |
Get Your Rates Quote Now |
All of the companies on this list have decent loss ratios, which is why AM Best has given them good ratings.
Companies with Best Ratings
An important part of a company’s success is how well it takes care of its customers. JD Power is one of the leading rankers of customer satisfaction, and its 2018 study looked at 44,622 auto insurance customers’ responses in order to rate major insurance companies in Virginia.
Take a look at the table below to see where Virginia’s companies rank.
Companies | Ranking | J.D. Power Circle Rating™ |
---|---|---|
USAA | 896 | 5 |
NJM Insurance | 864 | 5 |
Erie Insurance | 854 | 5 |
Geico | 848 | 4 |
The Hartford | 839 | 3 |
Mid-Atlantic Region | 838 | 3 |
Allstate | 837 | 3 |
Plymouth Rock Assurance | 835 | 3 |
Progressive | 835 | 3 |
State Farm | 826 | 2 |
Nationwide | 823 | 2 |
Travelers | 820 | 2 |
CSAA Insurance | 816 | 2 |
Farmers | 814 | 2 |
Liberty Mutual | 801 | 2 |
Get Your Rates Quote Now |
Erie insurance received a JD Power rating of “among the best,” while Geico received a “better than most” rating. If you value superb customer service, these two companies might be worth looking into.
Companies with the Most Complaints in Virginia
One part of the companies’ customer satisfaction process is dealing with customer complaints. To see how the largest companies in Virginia are handling complaints, we are going to take a look at NAIC’s complaint ratios.
Company | Total Complaints 2017 | Complaint Ratio 2017 |
---|---|---|
Liberty Mutual Group | 222 | 5.95 |
Progressive Group | 120 | 0.75 |
Erie Insurance Group | 22 | 0.70 |
Virginia Farm Bureau Group | 1 | 0.69 |
Allstate Insurance Group | 163 | 0.50 |
State Farm Group | 1,482 | 0.44 |
Nationwide Corp Group | 25 | 0.28 |
Travelers Group | 2 | 0.09 |
Geico | 2 | 0.00 |
USAA Group | 2 | 0.00 |
Get Your Rates Quote Now |
Liberty Mutual and Progressive have the highest complaint ratios out of the top ten largest companies. You might be wondering why State Farm has a lower complaint ratio even though it has the most complaints.
This is because the complaint ratio is based on the overall percentage of customers — a thousand customers complaining about State Farm is only a small percentage of State Farm’s customers.
Cheapest Companies in Virginia
If you are looking to save money, take a look at Quadrant’s information below on the cheapest insurance companies in Virginia.
Company | Average Annual Rate | Compared to State Average (+/-) | Compared to State Average (%) |
---|---|---|---|
Allstate P&C | $3,386.82 | $1,028.95 | 30.38% |
Progressive Advanced | $2,498.55 | $140.68 | 5.63% |
State Farm Mutual Auto | $2,268.92 | -$88.94 | -3.92% |
Nationwide P&C | $2,073.01 | -$284.86 | -13.74% |
Geico General | $2,061.51 | -$296.36 | -14.38% |
USAA | $1,858.39 | -$499.47 | -26.88% |
Get Your Rates Quote Now |
USAA is the cheapest provider, costing about 27 percent LESS than the state average. Quite a few other providers are also below the state average, showing that it pays to shop around for auto insurance.
Commute Rates by Companies
If you are looking to save money on auto insurance, be aware that sometimes a longer commute can add costs onto your annual premium.
Companies | 10-mile commute. 6,000 annual mileage. | 25-mile commute. 12,000 annual mileage. |
---|---|---|
USAA | $1,789.83 | $1,926.95 |
Geico | $2,022.99 | $2,100.03 |
Nationwide | $2,073.01 | $2,073.01 |
State Farm | $2,213.23 | $2,324.61 |
Progressive | $2,498.55 | $2,498.55 |
Allstate | $3,283.86 | $3,489.78 |
Get Your Rates Quote Now |
At Allstate, a longer commute adds on $206 to your premium! Saving on multiple small rate changes like this can add up into a large sum at the end of the year, so make sure to check if you paying more or less because of your commute.
Commute rates don’t have nearly as much of an impact on your rates as some other factors. Take a look.
Coverage Level Rates by Companies
Most people cringe when paying for a high coverage level, even when they know higher coverage is absolutely worth it in an accident. The good news is that higher coverage doesn’t always need to strain your bank account.
Some Virginian companies offer economical increases when switching from low to high coverage, as you can see from the Quadrant data below.
Companies | Low | Medium | High |
---|---|---|---|
USAA | $1,783.22 | $1,861.89 | $1,930.06 |
Geico | $1,982.21 | $2,059.38 | $2,142.93 |
State Farm | $2,135.49 | $2,265.45 | $2,405.83 |
Nationwide | $2,173.17 | $2,052.92 | $1,992.94 |
Progressive | $2,389.08 | $2,470.69 | $2,635.87 |
Allstate | $3,285.84 | $3,387.52 | $3,487.10 |
Get Your Rates Quote Now |
An increase from low to high coverage at Allstate only costs an extra $202 a year! This amounts to only an extra $17 a month. Other companies on the list also have similar price increases, which means you can find high coverage for a reasonable price at most companies in Virginia.
Credit History Rates by Companies
In Virginia, the average credit score is 680, which is above the national average of 675! This means Virginia residents have a better chance of receiving better rates on their auto insurance. Why?
Because insurers frequently look at your credit score to determine rates.
The Quadrant data below shows just how much credit can impact your rates.
Group | Annual Rate with Good Credit | Annual Rate with Fair Credit | Annual Rate with Poor Credit |
---|---|---|---|
USAA | $1,397.64 | $1,693.24 | $2,484.29 |
State Farm | $1,579.95 | $2,000.23 | $3,226.59 |
Nationwide | $1,791.14 | $1,972.48 | $2,455.42 |
Geico | $1,947.09 | $1,947.09 | $2,290.34 |
Progressive | $2,274.08 | $2,435.06 | $2,786.51 |
Allstate | $2,728.56 | $3,306.90 | $4,125.00 |
Get Your Rates Quote Now |
At most companies, bad credit will raise your rates over a thousand dollars. The best way to avoid dealing with huge rate increases is to maintain good credit.
Driving Record Rates by Companies
Another factor that impacts rates is a person’s driving record. DUIs, accidents, and speeding violations will all raise your rates by hundreds or thousands of dollars.
Keeping a clean driving record will save you a lot of money in the long run!
Companies | Clean record | With one speeding violation | With one accident | With One DUI |
---|---|---|---|---|
USAA | $1,439.41 | $1,656.09 | $1,869.24 | $2,468.83 |
Geico | $1,565.25 | $1,565.25 | $2,032.40 | $3,083.13 |
Nationwide | $1,802.52 | $1,802.52 | $2,045.46 | $2,641.55 |
State Farm | $2,071.20 | $2,268.92 | $2,466.65 | $2,268.92 |
Progressive | $2,134.65 | $2,484.88 | $2,827.50 | $2,547.17 |
Allstate | $2,532.44 | $3,264.59 | $4,044.27 | $3,705.98 |
Get Your Rates Quote Now |
At companies like Allstate, just one DUI will add roughly $1,500 onto a premium! So make sure to drive carefully, as a bad driving record will raise your rates SIGNIFICANTLY. Virginia even ranked first as one of the best states for affordable DUI auto insurance, so a DUI is a serious mark on a driving record.
Number of Insurers in Virginia
As the twelfth most populated state in the U.S., Virginia has more than a few insurers to pick from. As in every state, Virginia has a mix of both domestic and foreign insurers to choose from.
- Domestic Insurers: 19
- Foreign Insurers: 908
The difference between domestic and foreign insurers is quite simple. A domestic insurer has its home office based in Virginia while a foreign insurer is based in another state but still sells in Virginia.
Virginia State Laws
While knowing your state’s laws is important, it can often be confusing. The last thing people want is a driving ticket for breaking a law they didn’t fully understand or have never even heard of!
As well, laws change from state to state. Newcomers to Virginia may expect the laws to match that of their old state, but this isn’t always the case. Insurance laws and driving laws are different from state to state, and sometimes even a small difference may result in you unknowingly violating a law.
To help you navigate tricky state laws, we’ve covered everything from auto insurance laws to rules of the road. So stay with us, because we are going to dive straight into Virginia’s must-know state laws.
Auto Insurance Laws
By now, you know about the minimum insurance requirements for Virginia, but there are other auto insurance laws that go beyond the minimum amount, such as windshield coverage or low-cost insurance.
So hang with us, because we are going to cover all of this now.
How State Laws for Insurance are Determined
Virginia has a state filing process that is different than most U.S. states. The NAIC’s description of the process is below.
“The Bureau of Insurance is authorized to establish standard forms that insurers must use. Approval of coverage broadenings for individual insurers is also permitted.”
So what does this mean? Basically, the state insurance department doesn’t need to approve policies before drivers can use them, but insurers must fill out standard forms with the Bureau of Insurance.
Insurers can also broaden their coverages beyond the minimum amounts if the Bureau of Insurance approves it.
Windshield Coverage
Nobody wants to pay to have a tiny windshield crack repaired, but if your windshield crack meets one of the descriptions below, it is illegal according to Virginia law and needs to be repaired.
- A scratch greater than six inches by 1/4 inch in the area cleared by windshield wipers
- A crack above the bottom three inches of the windshield that is larger than 1 by 1/2 inches in diameter
- Multiple cracks in the same area if any crack is longer than 1 to 1/2 inches long
- Multiple cracks in the same area if above bottom three inches of the windshield
Though the state doesn’t require windshield coverage as per the Virginia Windshield Replacement Insurance laws, most comprehensive insurance plans will cover the costs of repair or replacement. Insurers are allowed to use aftermarket parts as long as they equal in quality to the original and insurers include a statement on the estimate.
High-Risk Insurance
If a driver is in a serious traffic accident or serious traffic violation, Virginia will label that driver as high-risk and require him or her to fill out an SR-22 form. Below is the DMV’s information on the main reasons Virginia drivers may need to fill out an SR-22 form.
- A car accident that results in a conviction of voluntary or involuntary manslaughter
- Falsifying a driver’s license, car registration, or insurance information
- A felony traffic conviction
- A hit-and-run accident
- Driving without insurance WITHOUT having paid the uninsured motor vehicle fee
The DMV explicitly states that high-risk drivers who fill out an SR-22 form are NOT allowed to purchase the uninsured motor vehicle fee. High-risk drivers are required to purchase Virginia’s minimum liability insurance and may face increased rates for a bad driving record.
If drivers are convicted of a DUI or driving with a license that’s been suspended because of a conviction, they must fill out an FR-44 form. Unlike an SR-22 form, drivers will have to purchase liability insurance that is HIGHER than the required minimum amounts. The DMV states these amounts as the following.
- $50,000 for bodily injury per person in an accident
- $100,000 for total bodily injury per accident
- $40,000 for property damages in an accident
Your average annual rates will increase with both the SR-22 and FR-44 forms, assuming you had insurance in the first place. Either way, both forms will result in significantly high rates.
Low-Cost Insurance
While Virginia doesn’t have a low-cost insurance program, there are still plenty of ways to save WITHOUT skipping out on insurance. Ask your provider about some of the common discounts listed below.
- Good driver discount
- Good student discount (usually requires a B+ average)
- Anti-theft discount
- Safety features discount
- Multi-car discount
- Homeowners’ discount
Every insurer will also have additional discounts beyond these, so ask your insurer for a full list to make sure you are getting the most out of the discounts available.
Automobile Insurance Fraud in Virginia
The Insurance Information Institute reported on a study that found $30 billion is stolen in fraudulent claims every year! Automobile fraud makes up about $4.8-6.8 billion of this number, with people attempting to commit automobile fraud through the following methods.
- Adding “extra” onto a legitimate claim by exaggerating or inventing expenses
- Creating a false claim for something that never happened, such as staging an accident
The Virginia State Police Insurance Fraud Program created a 2018 report on insurance fraud in Virginia. A total of 82 arrests were made, and below you will see the number of notifications the police department received for automobile fraud.
Type of Fraud | Fraudulent Automobile Notifications |
---|---|
Property Fraud | 931 |
Injury/Casualty Fraud | 188 |
Get Your Rates Quote Now |
Insurance fraud is a serious crime, resulting in fines and/or jail time. So make sure to be honest on your claims!
Statute of Limitations
A statute of limitations is the amount of time people have to file claims after an accident, and it starts counting down the day of the accident. A statute of limitations makes sure people file claims promptly so claim proceedings don’t drag on for years or decades past the accident.
Below, you will see Virginia’s statute of limitations.
- Personal Injury — Two years
- Property Damage — Five years
The sooner you file the claim the closer you are to receiving your insurance benefits, so don’t wait!
Virginia Unique State Laws
Virginia has an unfair claim settlement law, which means insurers are legally required to disclose all information on policies. This ensures that insurers don’t “forget” benefits when you file a claim.
This law also prevents insurers from ignoring your claim or refusing to pay reasonable claims.
While insurers are ethically required to follow these practices anyways, the law places extra emphasis on these guidelines. Another unique law is Virginia’s prohibition of radar detectors.
Police officers can fine you for having a radar detector in the car, even if it is turned off or broken. To avoid a fine, the radar detector has to be completely inaccessible to drivers (such as stored in the trunk of a car).
Vehicle Licensing Laws
Virginia has state-specific laws on vehicle licensing. If you are unsure what these are, we will cover everything from penalties for driving without insurance to license renewal procedures for different age groups.
So let’s jump right into it!
Penalties for Driving Without Insurance
Unless drivers have paid the UMV fee for driving uninsured, Virginia will penalize drivers for driving without the minimum liability coverage. If you haven’t paid the UMV fee and don’t have the minimum liability insurance, you will receive an intent to suspend car registration letter.
The DMV will also suspend your driver’s license and license plates. If drivers wish to reinstate their driving privileges, they will have to complete all of the following.
- Pay fines
- Mandatory filing of SR-22 form
- Driver’s license reinstatement fee
As a reminder, here are acceptable forms of financial responsibility. Proof of financial responsibility must be provided anytime you are pulled over in a traffic stop, register a vehicle, or are in an accident.
- Valid Insurance ID Card
- Proof that you paid the UMV fee
Virginia also has an electronic verification system that authorities use to check the status of vehicles.
Teen Driver Laws
Teens must be 15 and a half to apply for a learner’s license in Virginia. This is younger than most states, which means Virginian teens can get a jump start on the learning process.
Before teens can apply for a regular license or a restricted license, the Insurance Institute for Highway Safety (IIHS) specifies that teens must meet the requirements below.
License or Restricted License Requirements | Details |
---|---|
Mandatory Holding Period | 9 months |
Minimum Supervised Driving Time | 45 hours (15 of which must be at night) |
Minimum Age | 16 years and 3 months |
Get Your Rates Quote Now |
If teens receive a restricted license, they must continue to follow the special regulations and rules set by Virginia.
Virginia Restricted License Requirements | Details |
---|---|
Nighttime Restrictions | Midnight to 4 a.m. |
Passenger Restrictions (family members excepted unless noted otherwise) | First 12 months no more than 1 passenger younger than 21 After 12 months no more than 3 passengers younger than 21 |
When Restrictions can be Lifted | Details |
Nighttime Restrictions | Until age 18 (minimum age: 18) |
Passenger Restrictions | Until age 18 (minimum age: 18) |
Get Your Rates Quote Now |
Virginia allows more underage passengers to be in the car with teen drivers than other states. While Virginia allows this, bear in mind that the risk of a crash goes up with every underage passenger added to a teen driver’s car.
Older Driver License Renewal Procedures
In Virginia, older drivers have different license renewal procedures than the general population. Drivers 75 years old and older must follow the requirements listed below.
- License Renewal Cycle — Every five years
- Proof of Adequate Vision — Required at every renewal
- Mail or Online Renewal — Not permitted
Older drivers must visit in person every five years and provide proof of adequate vision at every license renewal, which means a trip to the eye doctor is necessary.
New Residents
Residents new to Virginia need to make sure their insurance is updated to meet Virginia’s minimum liability insurance. To do so, new residents will need to contact their current insurance provider to provide updated address information.
Insurers will make sure new residents have the proper coverage in the amounts below, as well as providing new residents with updated insurance ID cards.
- 25,000 to cover bodily injury costs per person in an accident for which you are at fault
- 50,000 to cover total bodily injury costs per accident for which you are at fault
- 20,000 to cover property damages in an accident for which you are at fault
- Uninsured/underinsured coverage
New residents may choose to opt out coverage, but need to pay the $500 UMV fee. This option is a lot riskier, as motorists will still be held liable for any accident costs and will have to cover all the bills themselves.
License Renewal Procedures
For the general population, license renewal procedures are fairly basic. Generally, the DMV will notify drivers well before their licenses expire, so that drivers have time to plan a trip to the DMV and prepare the necessary paperwork.
- License Renewal Cycle — Every eight years
- Proof of Adequate Vision — Required when renewing in person
- Mail or Online Renewal — Both permitted, every other renewal
Virginia’s licensing system means that drivers can go 16 years without an in-person trip to the DMV! This is quite a bit longer than most states. Just make sure to have proof of adequate vision ready when renewing in-person.
Virginia Reckless Driving Law
Any driving that endangers the driver, others, or property is deemed reckless driving. Virginia has a strict set of qualifications under which law enforcement may arrest drivers for reckless driving, such as speeding or racing other vehicles.
Even if reckless driving doesn’t necessarily endanger the drivers or others, committing certain traffic violations can result in a reckless driving charge.
- Driving with faulty brakes
- Passing on a curve or hill
- Driving with multiple people in the front seat who interfere with the driver’s ability to drive
- Passing two vehicles on a road with less than three lanes
- Driving abreast to another vehicle on a single-lane road
- Passing at a railroad or crossing on a single-lane road
- Not stopping for a school bus
- Not properly using turn signals
- Speeding at least 20 mph over the speed limit or driving over 80 mph
- Not properly stopping before entering a highway from a side street
- Entering a high-occupancy toll lane by crossing a barrier, buffer, or another separator
If law enforcement convicts drivers of reckless driving, drivers face the following penalties. Keep in mind that a reckless driving charge will also raise drivers’ insurance rates, which means that drivers will end up paying more than the fines below.
Key Info | Details |
---|---|
Name of Offense | Class 1 misdemeanor |
License Suspension | General: Up to six months Vehicle Racing: six months to two years |
Fine | Maximum $1,000 |
Jail Time | Up to six months |
Points | 4 to 6 |
Get Your Rates Quote Now |
Vehicle racing is a special circumstance, with judges REQUIRED to suspend driver’s license for a minimum of six months.
Not all reckless driving charges are equal. If an infraction is less serious, drivers may receive an improper driving charge. A fine for improper driving is only up to $500, and the charge is dropped down to a traffic infraction.
A driver charged with reckless driving while drunk may also try to plea bargain the charge down to a wet reckless, which carries the same penalties as a reckless charge but requires drivers to also complete an alcohol safety program.
Rules of the Road
Drivers who are experts on the rules of the road have a better chance of staying safe in case of an accident. Keep reading to learn about Virginia’s must-know rules of the road.
Fault vs No-Fault
Virginia is a fault state. This means that whoever caused the accident is liable for costs racked up by the accident, such as medical and property damage costs.
The downside is that auto insurance is optional in Virginia, which is why Virginia requires drivers to have uninsured and underinsured coverage! If you are in an accident with an uninsured driver and they are at fault, the likelihood is that he or she will be unable to pay your bills.
This is why it is so important to have decent insurance in Virginia, as insurance will help you pay expensive bills if you’re at fault or cover you if the at-fault driver can’t pay.
Seat Belt and Car Seat Laws
One of the first things new drivers are taught is to buckle up before starting the car. Unfortunately, not enough drivers follow this rule. The following car seat laws in Virginia are in place to encourage more drivers to buckle up themselves and their loved ones.
Key Info | Details |
---|---|
Initial Effective Date | January 1, 1988 |
Primary Enforcement | No |
Who is Covered? In What Seats? | 18+ years in front seat |
Maximum Base Fine | $25 (may be additional fees) |
Get Your Rates Quote Now |
Virginia doesn’t have primary enforcement, which means that officers can’t pull drivers over and ticket them just for not wearing a seat belt. If an officer pulls over a driver for a traffic violation and notices the driver isn’t wearing a seat belt, though, the officer can ticket the driver.
Child safety seat laws in Virginia are also enforced. Below is the IIHS’s list of requirements for children in car seats.
Type of Car Seat | Age and Weight |
---|---|
Rear-Facing Child Restraint | Younger than 2 years or until the child reaches the minimum weight limit for a forward facing child safety seat as prescribed by the manufacturer |
Child Safety Seat | 7 years and younger |
Preference for Rear-Facing Seat | Children in rear-facing devices must be in a rear seat if available; if not available, they may be placed in front only if front passenger airbag is deactivated |
Maximum Base Fine | $50 (additional fees may apply) |
Get Your Rates Quote Now |
As for riding in the cargo area of pickup trucks, Virginia has placed restrictions on passengers. You may ride in the cargo area ONLY if you meet one of the two requirements below.
- Age 16 years old or older
- Farmers when crossing highways to reach fields
If you do ride in a pickup truck, make sure to buckle up if possible, as people can easily be thrown from the vehicle at sharp turns.
Keep Right and Move Over Laws
in Virginia, drivers who are blocking traffic by traveling slower than the average speed of the traffic around them must move over and KEEP RIGHT. Generally, the right lane is for faster traffic and passing.
Unless you are passing or turning left, stick to the right lane if driving slower.
Virginia’s move over law is also simple but is vital in saving lives. Every year, people on the side of the road are injured or killed by drivers who fail to move over.
If you see a stationary emergency vehicle, tow truck, road maintenance, or utility vehicle with FLASHING LIGHTS parked in the same direction you are driving, you must move over to a lane further away. If you can’t move over, make sure to SLOW down and drive carefully past the stationary vehicle.
Speed Limits
States all have different speed limits. Make sure to familiarize yourself with Virginia’s maximum speed limits to avoid a speeding ticket.
Road Type | Speed Limit |
---|---|
Rural Interstates | 70 mph |
Urban Interstates | 70 mph |
Other Limited Access Roads | 65 mph |
Other Roads | 55 mph |
Get Your Rates Quote Now |
Remember that these are the maximum speed limits. Follow speed limit signs as speed limits will still vary from road to road in Virginia.
Ridesharing
If drivers want to work for a ridesharing company like Uber, they will need to purchase ridesharing insurance. The following insurers offer ridesharing insurance in Virginia.
- Allstate
- Erie
- Geico
- Liberty Mutual
Drivers NEED to purchase ridesharing insurance, especially in a state with numerous uninsured drivers. As well, drivers generally need to meet basic requirements for approval.
- 21 years old or older
- Driving experience
- Clean driving record
- Inspected and registered car
Ridesharing companies will differ slightly in the requirements necessary, but the above requirements are a good general guideline. If you are approved, you will then need to purchase the necessary ridesharing insurance.
Automation on the Road
At this point, Virginia doesn’t have any laws regulating automated vehicles and is still in the testing phase. There are actually several levels of automation, from automated features like lane departure warning to fully self-driving cars.
The video below explains these levels in-depth.
Safety Laws
The reason behind safety laws is in the name — to keep drivers as safe as possible on the roads. Virginia has several safety laws in place to discourage drivers from risky driving behaviors, such as drunk or distracted driving.
DUI Laws
In 2017 alone, 246 people died from alcohol-impaired driving accidents. So what has Virginia done to discourage these numbers from rising? Besides having a strict law in place, Virginia has multiple penalties that increase with each infraction.
The details of Virginia’s state DUI law are below.
Key Info | Details | |||
---|---|---|---|---|
BAC Limit | 0.08 | Look Back/Washout Period | ||
High BAC Limit | 0.15; 0.2 | |||
Criminal Status by Offense | 1st-2nd class 1 misdemeanors 3rd+ in 10 years class 6 felony | |||
Formal Name for Offense | Driving Under the Influence (DUI) | 10 years | ||
Look Back/Washout Period | 10 years | |||
Get Your Rates Quote Now |
As we stated, the penalties grow more severe with each infraction.
Offense | License Suspension | Fine | Jail Time | IID Lock | Other |
---|---|---|---|---|---|
1st | 1 year (restricted permit possible) | $250 mandatory minimum | Up to 1 year Mandatory 5 days if BAC 0.15-0.19 Mandatory 20 days if BAC .20+ | Required if BAC 0.15+ | VA Alcohol Safety Action Program (VASAP) required |
2nd | 3 years (restricted permit possible) | $500 mandatory minimum | Up to 1 year Within 5 years 1st offense, mandatory 20 day minimum Within 10 years 1st offense, mandatory 10 additional days If BAC .20+ mandatory 20 additional days | Required | VASAP required |
3rd | Indefinite (but can petition court after 5 years) | $1,000 mandatory minimum | 1-5 years Within 5 years of 1st offense, 6 month mandatory minimum Within 10 years of 1st offense, 90 day mandatory minimum | Required | VASAP required. Possible vehicle seizure |
Get Your Rates Quote Now |
Drivers convicted of a DUI must also fill out an FR-44 form. This requires drivers to purchase liability insurance that is higher than Virginia’s required minimum amounts.
Marijuana-Impaired Driving Laws
Virginia doesn’t have a marijuana-impaired driving law, but this doesn’t mean driving while high is legal! Authorities will charge marijuana-impaired drivers with impaired-driving, which carries many of the same penalties as a DUI.
Impaired-driving charges can result in a suspended license, fines, and/or jail time.
After all, impaired drivers not only risk their own safety but the safety of everyone around them!
Distracted Driving Laws
Distracted driving can be just as life-threatening as impaired-driving. All it takes is a moment of inattention for an accident to happen. That’s why Virginia has regulated the use of cellphones in cars so that drivers pay more attention to the road.
Key Info | Details |
---|---|
Hand-Held Ban | Drivers in highway work zones |
Young Drivers all Cellphone Ban | Drivers younger than 18 |
Texting Ban | All drivers |
Enforcement | Primary; secondary for drivers younger than 18 |
Get Your Rates Quote Now |
Though Virginia allows hand-held use except in highway work zones, it is good practice to avoid cellphone use in the car altogether.
Virginia Can’t-Miss Facts
Do you know what risk factors to watch out for in Virginia? Knowing your state’s risk factors can help you stay alert for potential dangers, as the last thing anyone wants is to be in an accident!
For example, Virginia’s woods are home to a variety of wildlife including deer. The result is that Virginia is ranked 12th in the U.S for deer collisions!
Keep reading to learn everything you need to know about Virginia’s risk factors, from vehicle theft to road dangers.
Vehicle Theft in Virginia
If you see your vehicle on the list below, it is one of the top ten stolen vehicles in Virginia!
Vehicle Make and Model | Vehicle Year | Total Thefts |
---|---|---|
Honda Accord | 2002 | 266 |
Ford Pickup (Full Size) | 2004 | 205 |
Honda Civic | 2013 | 200 |
Toyota Camry | 2014 | 181 |
Nissan Altima | 2015 | 162 |
Chevrolet Pickup (Full Size) | 2003 | 144 |
Toyota Corolla | 2013 | 140 |
Ford Explorer | 2002 | 119 |
Jeep Cherokee/Grand Cherokee | 2001 | 107 |
Chevrolet Impala | 2006 | 105 |
Get Your Rates Quote Now |
The FBI also compiled a 2013 report on vehicle thefts by cities, as crime rates can vary drastically depending on where people live.
City | Motor Vehicle Theft |
---|---|
Richmond | 938 |
Norfolk | 767 |
Virginia Beach | 445 |
Newport News | 344 |
Alexandria | 291 |
Chesapeake | 280 |
Hampton | 226 |
Portsmouth | 205 |
Roanoke | 180 |
Suffolk | 102 |
Get Your Rates Quote Now |
Out of the top 10 cities, Richmond City is the worst city for vehicle theft, with almost a thousand vehicles stolen in 2013!
Road Dangers in State
To help guide drivers through what road dangers to watch out for, we’ve compiled information on Virginia’s road dangers. Let’s jump right into everything from crash stats to fatality factors.
Fatal Crashes by Weather Condition and Light Condition
Since states have different weather conditions to watch out for, we want to take a look at Virginia’s fatalities during different types of weather conditions.
Weather Condition | Daylight | Dark, but Lighted | Dark | Dawn or Dusk | Other / Unknown | Total |
---|---|---|---|---|---|---|
Normal | 0 | 0 | 0 | 0 | 0 | 0 |
Rain | 27 | 15 | 25 | 4 | 1 | 72 |
Snow/Sleet | 1 | 0 | 2 | 0 | 0 | 3 |
Other | 2 | 1 | 2 | 2 | 0 | 7 |
Unknown | 394 | 83 | 196 | 28 | 0 | 701 |
TOTAL | 424 | 99 | 225 | 34 | 1 | 783 |
Get Your Rates Quote Now |
Be aware that RAIN is a major contributor to fatal crashes. From hydroplaning to impaired vision, rain can make driving difficult for even the most experienced drivers.
Fatalities (All Crashes) by County
The National Highway Traffic Safety Administration (NHTSA) has collected extensive data on crashes in Virginia. One of the first statistics we want to look at is how fatalities vary from county to county.
County | 2013 | 2014 | 2015 | 2016 | 2017 |
---|---|---|---|---|---|
Accomack County | 8 | 10 | 6 | 8 | 3 |
Albemarle County | 11 | 16 | 15 | 9 | 12 |
Alexandria City | 3 | 0 | 4 | 4 | 4 |
Alleghany County | 4 | 5 | 3 | 4 | 2 |
Amelia County | 4 | 1 | 3 | 5 | 7 |
Amherst County | 4 | 8 | 6 | 5 | 4 |
Appomattox County | 2 | 4 | 1 | 3 | 2 |
Arlington County | 2 | 8 | 5 | 1 | 5 |
Augusta County | 17 | 9 | 9 | 19 | 18 |
Bath County | 1 | 1 | 0 | 1 | 1 |
Bedford City | 0 | 0 | 0 | 0 | 0 |
Bedford County | 9 | 7 | 6 | 14 | 17 |
Bland County | 1 | 1 | 1 | 1 | 2 |
Botetourt County | 4 | 5 | 8 | 4 | 4 |
Bristol City | 2 | 1 | 0 | 0 | 0 |
Brunswick County | 11 | 9 | 6 | 7 | 5 |
Buchanan County | 7 | 3 | 6 | 3 | 6 |
Buckingham County | 1 | 11 | 2 | 8 | 7 |
Buena Vista City | 0 | 0 | 0 | 0 | 0 |
Campbell County | 4 | 9 | 7 | 11 | 8 |
Caroline County | 14 | 1 | 10 | 12 | 7 |
Carroll County | 11 | 4 | 7 | 6 | 8 |
Charles City County | 0 | 3 | 3 | 4 | 0 |
Charlotte County | 3 | 2 | 7 | 6 | 0 |
Charlottesville City | 1 | 0 | 0 | 2 | 0 |
Chesapeake City | 11 | 9 | 18 | 19 | 18 |
Chesterfield County | 26 | 19 | 28 | 25 | 34 |
Clarke County | 0 | 1 | 7 | 3 | 3 |
Clifton Forge City | 0 | 0 | 0 | 0 | 0 |
Colonial Heights City | 0 | 0 | 1 | 5 | 1 |
Covington City | 1 | 1 | 0 | 0 | 0 |
Craig County | 4 | 0 | 2 | 0 | 0 |
Culpeper County | 9 | 9 | 6 | 5 | 5 |
Cumberland County | 4 | 1 | 1 | 1 | 4 |
Danville City | 6 | 2 | 3 | 4 | 4 |
Dickenson County | 2 | 2 | 3 | 1 | 1 |
Dinwiddie County | 8 | 3 | 10 | 9 | 9 |
Emporia City | 1 | 1 | 0 | 0 | 0 |
Essex County | 1 | 5 | 3 | 3 | 3 |
Fairfax City | 2 | 0 | 0 | 4 | 0 |
Fairfax County | 40 | 33 | 31 | 34 | 34 |
Falls Church City | 0 | 0 | 0 | 0 | 0 |
Fauquier County | 6 | 9 | 19 | 15 | 9 |
Floyd County | 4 | 3 | 3 | 1 | 1 |
Fluvanna County | 6 | 3 | 7 | 0 | 6 |
Franklin City | 0 | 0 | 0 | 2 | 0 |
Franklin County | 8 | 7 | 7 | 16 | 12 |
Frederick County | 11 | 9 | 13 | 10 | 22 |
Fredericksburg City | 2 | 0 | 2 | 1 | 2 |
Galax City | 0 | 0 | 1 | 0 | 0 |
Giles County | 5 | 9 | 4 | 1 | 5 |
Gloucester County | 3 | 4 | 5 | 5 | 7 |
Goochland County | 5 | 3 | 9 | 2 | 5 |
Grayson County | 1 | 3 | 3 | 3 | 0 |
Greene County | 2 | 3 | 1 | 0 | 3 |
Greensville County | 2 | 7 | 2 | 5 | 2 |
Halifax County | 3 | 8 | 9 | 12 | 9 |
Hampton City | 9 | 10 | 8 | 8 | 8 |
Hanover County | 13 | 17 | 15 | 8 | 13 |
Harrisonburg City | 1 | 0 | 1 | 4 | 1 |
Henrico County | 24 | 18 | 18 | 21 | 24 |
Henry County | 10 | 13 | 16 | 13 | 13 |
Highland County | 0 | 1 | 0 | 1 | 0 |
Hopewell City | 1 | 2 | 1 | 0 | 0 |
Isle Of Wight County | 7 | 9 | 2 | 4 | 4 |
James City County | 8 | 5 | 8 | 4 | 15 |
King And Queen County | 1 | 2 | 3 | 2 | 4 |
King George County | 8 | 11 | 5 | 6 | 9 |
King William County | 3 | 3 | 1 | 3 | 3 |
Lancaster County | 4 | 1 | 2 | 4 | 3 |
Lee County | 4 | 2 | 7 | 5 | 3 |
Lexington City | 2 | 0 | 0 | 0 | 0 |
Loudoun County | 13 | 12 | 11 | 12 | 21 |
Louisa County | 12 | 3 | 6 | 10 | 7 |
Lunenburg County | 3 | 3 | 1 | 3 | 5 |
Lynchburg City | 1 | 3 | 2 | 1 | 2 |
Madison County | 1 | 1 | 3 | 1 | 3 |
Manassas City | 0 | 0 | 0 | 0 | 2 |
Manassas Park City | 0 | 0 | 0 | 0 | 0 |
Martinsville City | 1 | 0 | 0 | 0 | 0 |
Mathews County | 6 | 1 | 1 | 2 | 2 |
Mecklenburg County | 11 | 9 | 6 | 8 | 10 |
Middlesex County | 1 | 2 | 2 | 1 | 2 |
Montgomery County | 9 | 4 | 6 | 5 | 13 |
Nelson County | 4 | 2 | 7 | 0 | 4 |
New Kent County | 4 | 8 | 8 | 5 | 3 |
Newport News City | 10 | 11 | 15 | 17 | 16 |
Norfolk City | 25 | 21 | 15 | 18 | 19 |
Northampton County | 1 | 3 | 3 | 9 | 3 |
Northumberland County | 2 | 2 | 1 | 2 | 1 |
Norton City | 1 | 0 | 0 | 0 | 0 |
Nottoway County | 3 | 4 | 5 | 5 | 3 |
Orange County | 8 | 6 | 6 | 6 | 8 |
Page County | 1 | 2 | 3 | 4 | 3 |
Patrick County | 6 | 4 | 4 | 1 | 6 |
Petersburg City | 2 | 3 | 0 | 6 | 2 |
Pittsylvania County | 8 | 16 | 19 | 14 | 14 |
Poquoson City | 0 | 0 | 2 | 0 | 0 |
Portsmouth City | 3 | 5 | 5 | 8 | 13 |
Powhatan County | 7 | 5 | 4 | 1 | 4 |
Prince Edward County | 6 | 4 | 7 | 5 | 7 |
Prince George County | 10 | 6 | 13 | 3 | 6 |
Prince William County | 18 | 23 | 11 | 30 | 22 |
Pulaski County | 4 | 9 | 2 | 2 | 9 |
Radford City | 0 | 1 | 1 | 0 | 2 |
Rappahannock County | 0 | 0 | 0 | 0 | 3 |
Richmond City | 12 | 9 | 13 | 16 | 21 |
Richmond County | 0 | 1 | 1 | 4 | 1 |
Roanoke City | 6 | 7 | 4 | 9 | 12 |
Roanoke County | 9 | 4 | 10 | 5 | 8 |
Rockbridge County | 2 | 9 | 7 | 9 | 8 |
Rockingham County | 12 | 18 | 10 | 12 | 12 |
Russell County | 4 | 1 | 9 | 6 | 8 |
Salem City | 1 | 0 | 1 | 0 | 2 |
Scott County | 3 | 3 | 3 | 2 | 4 |
Shenandoah County | 7 | 4 | 7 | 6 | 4 |
Smyth County | 5 | 4 | 4 | 3 | 3 |
South Boston City (No Longer A County Equivalent) | 0 | 0 | 0 | 0 | 0 |
Southampton County | 9 | 4 | 5 | 2 | 4 |
Spotsylvania County | 11 | 11 | 11 | 14 | 12 |
Stafford County | 8 | 5 | 15 | 9 | 9 |
Staunton City | 1 | 0 | 1 | 1 | 0 |
Suffolk City | 14 | 12 | 15 | 7 | 18 |
Surry County | 1 | 1 | 2 | 3 | 1 |
Sussex County | 0 | 4 | 3 | 8 | 13 |
Tazewell County | 6 | 4 | 5 | 3 | 5 |
Virginia Beach City | 27 | 29 | 16 | 19 | 25 |
Warren County | 5 | 8 | 4 | 7 | 6 |
Washington County | 6 | 8 | 9 | 6 | 8 |
Waynesboro City | 2 | 1 | 1 | 1 | 1 |
Westmoreland County | 0 | 3 | 5 | 0 | 2 |
Williamsburg City | 0 | 0 | 0 | 0 | 0 |
Winchester City | 0 | 0 | 1 | 1 | 0 |
Wise County | 8 | 5 | 4 | 6 | 1 |
Wythe County | 4 | 4 | 14 | 6 | 10 |
York County | 4 | 5 | 5 | 9 | 5 |
Get Your Rates Quote Now |
Fairfax County consistently has some of the highest fatalities from 2013 to 2017.
Traffic Fatalities
Often, road types show trends in the number of overall fatalities. Generally, rural roads have more fatal crashes because of the higher speed limits. Rural roads also carry more unique dangers, such as crashing into wildlife.
Road Type | 2008 | 2009 | 2010 | 2011 | 2012 | 2013 | 2014 | 2015 | 2016 | 2017 |
---|---|---|---|---|---|---|---|---|---|---|
Rural | 479 | 421 | 308 | 405 | 500 | 473 | 448 | 484 | 477 | 519 |
Urban | 343 | 334 | 234 | 279 | 259 | 260 | 247 | 269 | 281 | 319 |
Unknown | 3 | 3 | 198 | 80 | 17 | 7 | 8 | 1 | 2 | 1 |
Total | 825 | 758 | 740 | 764 | 776 | 740 | 703 | 754 | 760 | 839 |
Get Your Rates Quote Now |
Virginia has fairly high numbers, with a total of 700 to 900 deaths each year.
Fatalities by Person Type
The type of car driven can sometimes show trends in fatalities, and car occupants aren’t the only ones at risk in a crash! Pedestrians, cyclists, and motorcyclists die every year from vehicle accidents.
Person Type | 2013 | 2014 | 2015 | 2016 | 2017 |
---|---|---|---|---|---|
Passenger Car | 331 | 299 | 323 | 308 | 320 |
Light Truck - Pickup | 87 | 86 | 103 | 82 | 111 |
Light Truck - Utility | 99 | 68 | 103 | 88 | 111 |
Light Truck - Van | 32 | 23 | 24 | 30 | 32 |
Light Truck - Other | 0 | 0 | 1 | 6 | 0 |
Large Truck | 24 | 22 | 19 | 25 | 18 |
Bus | 1 | 1 | 0 | 0 | 0 |
Other/Unknown Occupants | 1 | 10 | 8 | 8 | 5 |
Total Motorcyclists | 79 | 90 | 79 | 79 | 117 |
Pedestrian | 75 | 88 | 77 | 122 | 111 |
Bicyclist and Other Cyclist | 8 | 12 | 15 | 10 | 12 |
Other/Unknown Nonoccupants | 3 | 4 | 2 | 2 | 2 |
Total | 740 | 703 | 754 | 760 | 839 |
Get Your Rates Quote Now |
Whether a driver or pedestrian, always be careful on roadways and keep a close eye out for activity around you.
Fatalities by Crash Type
Crashes can vary in fatality rates based on the crash type.
Crash Type | 2013 | 2014 | 2015 | 2016 | 2017 |
---|---|---|---|---|---|
- (1) Single Vehicle | 461 | 436 | 474 | 476 | 493 |
- (2) Involving a Large Truck | 89 | 90 | 71 | 91 | 98 |
- (3) Involving Speeding | 132 | 99 | 105 | 257 | 219 |
- (4) Involving a Rollover | 188 | 146 | 194 | 163 | 186 |
- (5) Involving a Roadway Departure | 498 | 443 | 492 | 444 | 511 |
- (6) Involving an Intersection (or Intersection Related) | 138 | 164 | 170 | 177 | 189 |
Total Fatalities (All Crashes) | 740 | 703 | 754 | 760 | 839 |
Get Your Rates Quote Now |
in Virginia, roadway departure accidents have the highest fatality rates, followed by single-vehicle accidents. A roadway departure accident is simply when a driver leaves the road by crossing the center or edge line.
Five-year Trend for the Top 10 Counties
Another statistic we want to look at is the counties with the highest fatality rates in Virginia.
County | 2013 | 2014 | 2015 | 2016 | 2017 |
---|---|---|---|---|---|
Chesterfield County | 26 | 19 | 28 | 25 | 34 |
Fairfax County | 40 | 33 | 31 | 34 | 34 |
Virginia Beach City | 27 | 29 | 16 | 19 | 25 |
Henrico County | 24 | 18 | 18 | 21 | 24 |
Frederick County | 11 | 9 | 13 | 10 | 22 |
Prince William County | 18 | 23 | 11 | 30 | 22 |
Loudoun County | 13 | 12 | 11 | 12 | 21 |
Richmond City | 12 | 9 | 13 | 16 | 21 |
Norfolk City | 25 | 21 | 15 | 18 | 19 |
Augusta County | 17 | 9 | 9 | 19 | 18 |
All Other Counties | 522 | 493 | 559 | 541 | 599 |
All Counties Total | 740 | 703 | 754 | 759 | 839 |
Get Your Rates Quote Now |
In 2017, Chesterfield County and Fairfax County tied for the highest fatality number.
Fatalities Involving Speeding by County
One of the riskiest behaviors numerous drivers participate in is speeding.
County | 2013 | 2014 | 2015 | 2016 | 2017 |
---|---|---|---|---|---|
Accomack County | 1 | 0 | 1 | 3 | 2 |
Albemarle County | 2 | 0 | 1 | 2 | 2 |
Alexandria City | 0 | 0 | 1 | 1 | 2 |
Alleghany County | 0 | 1 | 2 | 1 | 0 |
Amelia County | 1 | 1 | 0 | 3 | 5 |
Amherst County | 1 | 1 | 1 | 2 | 1 |
Appomattox County | 0 | 0 | 0 | 1 | 0 |
Arlington County | 0 | 1 | 2 | 0 | 0 |
Augusta County | 3 | 3 | 3 | 5 | 5 |
Bath County | 0 | 0 | 0 | 0 | 0 |
Bedford City | 0 | 0 | 0 | 0 | 0 |
Bedford County | 2 | 0 | 0 | 8 | 6 |
Bland County | 1 | 0 | 0 | 0 | 0 |
Botetourt County | 0 | 0 | 0 | 2 | 0 |
Bristol City | 1 | 0 | 0 | 0 | 0 |
Brunswick County | 1 | 2 | 0 | 2 | 2 |
Buchanan County | 3 | 1 | 4 | 1 | 2 |
Buckingham County | 1 | 3 | 0 | 6 | 1 |
Buena Vista City | 0 | 0 | 0 | 0 | 0 |
Campbell County | 0 | 3 | 1 | 5 | 4 |
Caroline County | 1 | 0 | 0 | 7 | 2 |
Carroll County | 2 | 1 | 0 | 0 | 3 |
Charles City County | 0 | 0 | 1 | 2 | 0 |
Charlotte County | 1 | 0 | 0 | 2 | 0 |
Charlottesville City | 0 | 0 | 0 | 1 | 0 |
Chesapeake City | 2 | 0 | 2 | 5 | 6 |
Chesterfield County | 2 | 3 | 8 | 14 | 8 |
Clarke County | 0 | 0 | 0 | 1 | 1 |
Clifton Forge City | 0 | 0 | 0 | 0 | 0 |
Colonial Heights City | 0 | 0 | 0 | 1 | 0 |
Covington City | 0 | 0 | 0 | 0 | 0 |
Craig County | 0 | 0 | 0 | 0 | 0 |
Culpeper County | 1 | 0 | 0 | 1 | 0 |
Cumberland County | 0 | 1 | 0 | 0 | 3 |
Danville City | 1 | 0 | 0 | 0 | 1 |
Dickenson County | 2 | 1 | 1 | 0 | 1 |
Dinwiddie County | 2 | 0 | 1 | 2 | 3 |
Emporia City | 1 | 0 | 0 | 0 | 0 |
Essex County | 0 | 1 | 0 | 1 | 0 |
Fairfax City | 0 | 0 | 0 | 1 | 0 |
Fairfax County | 9 | 7 | 8 | 12 | 14 |
Falls Church City | 0 | 0 | 0 | 0 | 0 |
Fauquier County | 1 | 1 | 2 | 6 | 2 |
Floyd County | 0 | 0 | 0 | 0 | 0 |
Fluvanna County | 0 | 0 | 2 | 0 | 0 |
Franklin City | 0 | 0 | 0 | 0 | 0 |
Franklin County | 0 | 0 | 0 | 4 | 3 |
Frederick County | 2 | 0 | 2 | 1 | 4 |
Fredericksburg City | 0 | 0 | 0 | 1 | 0 |
Galax City | 0 | 0 | 0 | 0 | 0 |
Giles County | 1 | 1 | 1 | 0 | 0 |
Gloucester County | 0 | 0 | 2 | 1 | 1 |
Goochland County | 0 | 0 | 5 | 0 | 0 |
Grayson County | 0 | 0 | 0 | 1 | 0 |
Greene County | 1 | 1 | 0 | 0 | 0 |
Greensville County | 0 | 0 | 0 | 2 | 1 |
Halifax County | 0 | 1 | 0 | 3 | 2 |
Hampton City | 2 | 3 | 3 | 1 | 2 |
Hanover County | 2 | 0 | 1 | 5 | 4 |
Harrisonburg City | 0 | 0 | 0 | 0 | 1 |
Henrico County | 3 | 1 | 1 | 6 | 0 |
Henry County | 0 | 2 | 2 | 4 | 6 |
Highland County | 0 | 0 | 0 | 0 | 0 |
Hopewell City | 0 | 0 | 0 | 0 | 0 |
Isle Of Wight County | 2 | 2 | 0 | 0 | 1 |
James City County | 1 | 0 | 0 | 1 | 3 |
King And Queen County | 0 | 1 | 0 | 0 | 2 |
King George County | 0 | 2 | 0 | 3 | 5 |
King William County | 0 | 0 | 0 | 2 | 1 |
Lancaster County | 0 | 0 | 0 | 1 | 2 |
Lee County | 1 | 2 | 1 | 2 | 0 |
Lexington City | 0 | 0 | 0 | 0 | 0 |
Loudoun County | 3 | 2 | 2 | 5 | 10 |
Louisa County | 3 | 1 | 0 | 7 | 3 |
Lunenburg County | 1 | 1 | 0 | 2 | 1 |
Lynchburg City | 0 | 0 | 0 | 0 | 1 |
Madison County | 0 | 0 | 0 | 0 | 1 |
Manassas City | 0 | 0 | 0 | 0 | 0 |
Manassas Park City | 0 | 0 | 0 | 0 | 0 |
Martinsville City | 1 | 0 | 0 | 0 | 0 |
Mathews County | 0 | 0 | 0 | 0 | 0 |
Mecklenburg County | 2 | 0 | 1 | 2 | 3 |
Middlesex County | 0 | 1 | 0 | 0 | 0 |
Montgomery County | 1 | 1 | 2 | 0 | 5 |
Nelson County | 0 | 0 | 2 | 0 | 1 |
New Kent County | 4 | 0 | 1 | 3 | 0 |
Newport News City | 1 | 3 | 5 | 7 | 6 |
Norfolk City | 7 | 5 | 3 | 2 | 0 |
Northampton County | 0 | 0 | 1 | 0 | 1 |
Northumberland County | 0 | 0 | 0 | 1 | 0 |
Norton City | 0 | 0 | 0 | 0 | 0 |
Nottoway County | 0 | 0 | 0 | 3 | 2 |
Orange County | 1 | 1 | 0 | 2 | 0 |
Page County | 0 | 0 | 0 | 3 | 2 |
Patrick County | 0 | 0 | 1 | 0 | 0 |
Petersburg City | 1 | 0 | 0 | 2 | 0 |
Pittsylvania County | 2 | 1 | 1 | 4 | 4 |
Poquoson City | 0 | 0 | 0 | 0 | 0 |
Portsmouth City | 0 | 2 | 0 | 4 | 1 |
Powhatan County | 1 | 0 | 0 | 0 | 1 |
Prince Edward County | 0 | 0 | 0 | 2 | 4 |
Prince George County | 0 | 0 | 0 | 0 | 1 |
Prince William County | 4 | 6 | 2 | 14 | 9 |
Pulaski County | 1 | 0 | 0 | 0 | 1 |
Radford City | 0 | 0 | 0 | 0 | 0 |
Rappahannock County | 0 | 0 | 0 | 0 | 1 |
Richmond City | 2 | 0 | 1 | 5 | 2 |
Richmond County | 0 | 0 | 0 | 1 | 1 |
Roanoke City | 2 | 0 | 4 | 2 | 3 |
Roanoke County | 3 | 1 | 0 | 2 | 2 |
Rockbridge County | 0 | 2 | 0 | 3 | 1 |
Rockingham County | 5 | 5 | 2 | 5 | 4 |
Russell County | 1 | 0 | 2 | 1 | 1 |
Salem City | 0 | 0 | 0 | 0 | 1 |
Scott County | 0 | 1 | 0 | 0 | 0 |
Shenandoah County | 1 | 0 | 0 | 2 | 2 |
Smyth County | 0 | 0 | 0 | 0 | 0 |
South Boston City (No Longer A County Equivalent) | 0 | 0 | 0 | 0 | 0 |
Southampton County | 2 | 1 | 0 | 0 | 0 |
Spotsylvania County | 4 | 0 | 3 | 4 | 5 |
Stafford County | 1 | 1 | 2 | 2 | 3 |
Staunton City | 0 | 0 | 0 | 0 | 0 |
Suffolk City | 6 | 2 | 1 | 2 | 1 |
Surry County | 0 | 0 | 0 | 1 | 1 |
Sussex County | 0 | 1 | 1 | 5 | 7 |
Tazewell County | 1 | 0 | 3 | 2 | 1 |
Virginia Beach City | 7 | 6 | 2 | 8 | 6 |
Warren County | 0 | 0 | 0 | 1 | 2 |
Washington County | 5 | 1 | 1 | 4 | 0 |
Waynesboro City | 1 | 0 | 0 | 0 | 0 |
Westmoreland County | 0 | 0 | 2 | 0 | 0 |
Williamsburg City | 0 | 0 | 0 | 0 | 0 |
Winchester City | 0 | 0 | 0 | 0 | 0 |
Wise County | 0 | 2 | 0 | 3 | 1 |
Wythe County | 0 | 2 | 1 | 2 | 2 |
York County | 1 | 3 | 0 | 2 | 1 |
Get Your Rates Quote Now |
Out of all the counties, Fairfax County has the most speeding deaths.
Fatalities in Crashes Involving an Alcohol-Impaired Driver (BAC=.08+) by County
Drunk driving is a major contributor to fatalities each year. Too many people decide one more drink won’t hurt and put themselves and others at SIGNIFICANT risk!
County | 2013 | 2014 | 2015 | 2016 | 2017 |
---|---|---|---|---|---|
Accomack County | 4 | 3 | 1 | 3 | 1 |
Albemarle County | 5 | 5 | 4 | 3 | 6 |
Alexandria City | 1 | 0 | 2 | 1 | 1 |
Alleghany County | 1 | 1 | 2 | 2 | 2 |
Amelia County | 1 | 0 | 1 | 2 | 3 |
Amherst County | 0 | 0 | 1 | 2 | 1 |
Appomattox County | 1 | 0 | 0 | 2 | 0 |
Arlington County | 1 | 2 | 2 | 0 | 1 |
Augusta County | 5 | 3 | 5 | 7 | 4 |
Bath County | 0 | 0 | 0 | 0 | 0 |
Bedford City | 0 | 0 | 0 | 0 | 0 |
Bedford County | 3 | 2 | 4 | 7 | 6 |
Bland County | 1 | 0 | 1 | 0 | 0 |
Botetourt County | 4 | 1 | 2 | 0 | 1 |
Bristol City | 1 | 0 | 0 | 0 | 0 |
Brunswick County | 1 | 4 | 1 | 0 | 0 |
Buchanan County | 4 | 1 | 1 | 2 | 1 |
Buckingham County | 1 | 6 | 2 | 6 | 2 |
Buena Vista City | 0 | 0 | 0 | 0 | 0 |
Campbell County | 1 | 2 | 1 | 6 | 4 |
Caroline County | 4 | 0 | 2 | 3 | 2 |
Carroll County | 2 | 2 | 1 | 1 | 2 |
Charles City County | 0 | 2 | 1 | 2 | 0 |
Charlotte County | 1 | 0 | 1 | 3 | 0 |
Charlottesville City | 0 | 0 | 0 | 1 | 0 |
Chesapeake City | 4 | 2 | 6 | 5 | 6 |
Chesterfield County | 11 | 8 | 8 | 11 | 7 |
Clarke County | 0 | 0 | 1 | 0 | 0 |
Clifton Forge City | 0 | 0 | 0 | 0 | 0 |
Colonial Heights City | 0 | 0 | 1 | 3 | 0 |
Covington City | 0 | 0 | 0 | 0 | 0 |
Craig County | 3 | 0 | 2 | 0 | 0 |
Culpeper County | 4 | 1 | 1 | 2 | 1 |
Cumberland County | 1 | 0 | 0 | 0 | 2 |
Danville City | 1 | 0 | 1 | 0 | 0 |
Dickenson County | 2 | 0 | 0 | 0 | 1 |
Dinwiddie County | 4 | 1 | 2 | 3 | 1 |
Emporia City | 1 | 0 | 0 | 0 | 0 |
Essex County | 0 | 2 | 0 | 2 | 2 |
Fairfax City | 0 | 0 | 0 | 1 | 0 |
Fairfax County | 16 | 10 | 4 | 9 | 11 |
Falls Church City | 0 | 0 | 0 | 0 | 0 |
Fauquier County | 2 | 3 | 4 | 4 | 1 |
Floyd County | 3 | 0 | 1 | 0 | 1 |
Fluvanna County | 4 | 2 | 1 | 0 | 0 |
Franklin City | 0 | 0 | 0 | 0 | 0 |
Franklin County | 1 | 4 | 2 | 1 | 3 |
Frederick County | 4 | 1 | 3 | 1 | 7 |
Fredericksburg City | 0 | 0 | 0 | 1 | 1 |
Galax City | 0 | 0 | 0 | 0 | 0 |
Giles County | 0 | 2 | 0 | 0 | 2 |
Gloucester County | 1 | 1 | 3 | 1 | 3 |
Goochland County | 3 | 2 | 4 | 0 | 2 |
Grayson County | 0 | 1 | 0 | 3 | 0 |
Greene County | 1 | 0 | 0 | 0 | 1 |
Greensville County | 0 | 2 | 0 | 1 | 1 |
Halifax County | 2 | 2 | 3 | 3 | 2 |
Hampton City | 4 | 5 | 3 | 2 | 2 |
Hanover County | 3 | 5 | 5 | 3 | 3 |
Harrisonburg City | 0 | 0 | 0 | 0 | 0 |
Henrico County | 10 | 8 | 4 | 7 | 4 |
Henry County | 5 | 2 | 4 | 3 | 3 |
Highland County | 0 | 1 | 0 | 0 | 0 |
Hopewell City | 1 | 0 | 1 | 0 | 0 |
Isle Of Wight County | 3 | 3 | 1 | 2 | 2 |
James City County | 3 | 2 | 2 | 1 | 9 |
King And Queen County | 1 | 0 | 0 | 0 | 2 |
King George County | 1 | 3 | 1 | 4 | 1 |
King William County | 1 | 0 | 0 | 1 | 1 |
Lancaster County | 2 | 1 | 0 | 2 | 1 |
Lee County | 3 | 0 | 2 | 2 | 0 |
Lexington City | 0 | 0 | 0 | 0 | 0 |
Loudoun County | 4 | 4 | 4 | 2 | 11 |
Louisa County | 7 | 1 | 1 | 6 | 4 |
Lunenburg County | 2 | 1 | 1 | 0 | 3 |
Lynchburg City | 0 | 0 | 1 | 0 | 1 |
Madison County | 0 | 0 | 1 | 1 | 0 |
Manassas City | 0 | 0 | 0 | 0 | 0 |
Manassas Park City | 0 | 0 | 0 | 0 | 0 |
Martinsville City | 0 | 0 | 0 | 0 | 0 |
Mathews County | 1 | 0 | 0 | 0 | 0 |
Mecklenburg County | 3 | 0 | 0 | 4 | 4 |
Middlesex County | 1 | 1 | 1 | 0 | 0 |
Montgomery County | 3 | 2 | 2 | 0 | 4 |
Nelson County | 0 | 1 | 3 | 0 | 1 |
New Kent County | 2 | 2 | 2 | 1 | 0 |
Newport News City | 4 | 3 | 6 | 5 | 5 |
Norfolk City | 9 | 10 | 5 | 3 | 6 |
Northampton County | 0 | 0 | 1 | 0 | 0 |
Northumberland County | 1 | 1 | 0 | 1 | 0 |
Norton City | 0 | 0 | 0 | 0 | 0 |
Nottoway County | 1 | 1 | 1 | 1 | 0 |
Orange County | 5 | 1 | 2 | 2 | 3 |
Page County | 0 | 1 | 1 | 1 | 1 |
Patrick County | 3 | 0 | 2 | 0 | 1 |
Petersburg City | 1 | 2 | 0 | 3 | 0 |
Pittsylvania County | 5 | 4 | 7 | 6 | 6 |
Poquoson City | 0 | 0 | 1 | 0 | 0 |
Portsmouth City | 1 | 1 | 1 | 3 | 5 |
Powhatan County | 4 | 1 | 1 | 0 | 1 |
Prince Edward County | 2 | 2 | 2 | 3 | 1 |
Prince George County | 3 | 1 | 3 | 1 | 1 |
Prince William County | 3 | 5 | 1 | 9 | 5 |
Pulaski County | 1 | 3 | 0 | 0 | 3 |
Radford City | 0 | 0 | 0 | 0 | 0 |
Rappahannock County | 0 | 0 | 0 | 0 | 1 |
Richmond City | 5 | 5 | 5 | 6 | 3 |
Richmond County | 0 | 0 | 0 | 1 | 0 |
Roanoke City | 1 | 4 | 4 | 4 | 4 |
Roanoke County | 2 | 1 | 2 | 3 | 2 |
Rockbridge County | 1 | 3 | 2 | 1 | 2 |
Rockingham County | 6 | 6 | 1 | 3 | 4 |
Russell County | 1 | 0 | 3 | 1 | 4 |
Salem City | 0 | 0 | 0 | 0 | 0 |
Scott County | 0 | 1 | 1 | 2 | 0 |
Shenandoah County | 1 | 0 | 1 | 0 | 0 |
Smyth County | 0 | 1 | 2 | 0 | 1 |
South Boston City (No Longer A County Equivalent) | 0 | 0 | 0 | 0 | 0 |
Southampton County | 1 | 4 | 2 | 0 | 1 |
Spotsylvania County | 2 | 6 | 3 | 5 | 8 |
Stafford County | 4 | 1 | 3 | 1 | 4 |
Staunton City | 0 | 0 | 0 | 0 | 0 |
Suffolk City | 4 | 4 | 3 | 0 | 3 |
Surry County | 0 | 0 | 1 | 1 | 0 |
Sussex County | 0 | 2 | 0 | 1 | 6 |
Tazewell County | 1 | 1 | 2 | 1 | 0 |
Virginia Beach City | 11 | 13 | 7 | 4 | 8 |
Warren County | 3 | 3 | 2 | 2 | 1 |
Washington County | 2 | 1 | 1 | 1 | 0 |
Waynesboro City | 1 | 0 | 0 | 0 | 0 |
Westmoreland County | 0 | 0 | 2 | 0 | 1 |
Williamsburg City | 0 | 0 | 0 | 0 | 0 |
Winchester City | 0 | 0 | 0 | 0 | 0 |
Wise County | 2 | 2 | 0 | 1 | 0 |
Wythe County | 0 | 1 | 5 | 1 | 2 |
York County | 2 | 4 | 1 | 2 | 1 |
Get Your Rates Quote Now |
Fairfax County once again ranks as first for fatalities involving an alcohol-impaired driver.
Teen Drinking and Driving
Adults aren’t the only ones included in fatality statistics. Many teens participate in underage drinking and driving every year. In the U.S., 1.2 teens per 100,000 population die from alcohol-impaired driving.
Virginia’s rate is just slightly below this. In Virginia, 1.1 teens die from alcohol-impaired driving per 100,000 population.
With teen fatalities occurring every year from drinking and driving, Virginia makes multiple arrests every year to try and keep teen drinking and driving under control.
Key Info | Details |
---|---|
DUI Arrests (under 18-years-old) | 97 |
DUI Arrests (under 18-years-old) Total Per Million People | 51.87 |
Rank | 38 |
Get Your Rates Quote Now |
Virginia ranks as 38th in the U.S. for its number of arrests, which means Virginia could work a little harder at its underage arrest records. Taking drunk drivers off the streets protects both them and others.
EMS Response Time
Usually, the first thing we do in an accident is to make a call for help. If you or someone else is injured, you want help to arrive as fast as possible. This is where emergency medical services come in.
Below, you will see Virginia’s EMS response times for both rural and urban areas.
Location of Incident | Time of Crash to EMS Notification | EMS Notification to EMS Arrival | EMS Arrival at Scene to Hospital Arrival | Time of Crash to Hospital Arrival | Total Fatalities in Crashes |
---|---|---|---|---|---|
Rural | 8.44 min | 12.70 min | 43.09 min | 60.04 min | 447 |
Urban | 5.69 min | 7.93 min | 29.76 min | 39.96 min | 273 |
Get Your Rates Quote Now |
Virginia’s EMS response times are little longer than most, as rural crashes take about an hour from the time of the crash to hospital arrival.
Transportation
How do you get around every day? Most likely, you own and drive a car like most Virginians.
Most of Virginians own two cars, followed by three cars.
Commute Time
The average commute time in the U.S. is 25.3 minutes. Unfortunately, Virginia’s average commute time is slightly above this at 27 minutes.
Commuter Transportation
In every U.S. state, driving alone is the most common commute option, though people are beginning to turn to other commute options.
About 10 percent of people carpool in Virginia, while others turn to public transport or working at home.
Traffic Congestion in Virginia
While Virginia residents spend a few minutes more commuting than other states, the good news is that only one of Virginia’s cities made it onto Inrix’s global traffic scorecard.
Key Info | Details |
---|---|
Hours Lost in Congestion | 56 |
Year-over-Year Change | 6% |
Cost of Congestion Per Driver | $781 |
Inner City Travel Time (Minutes) | 4 |
Inner City Last Mile Speed (mph) | 15 |
Get Your Rates Quote Now |
If you are planning on traveling through Norfolk city, you may want to allow a little extra time for traffic congestion.
Whew! You’ve reached the end of our comprehensive guide! Hopefully, you feel more than prepared to drive through Virginia’s beautiful and historic state. Enter your ZIP code in our FREE online tool below to start comparison shopping today.
- https://www.dmv.virginia.gov/commercial/#insurance/generalinfo.asp
- https://www.worldatlas.com/articles/us-states-by-population.html
- https://crackedwindshieldlaws.com/virginia/
- https://www.dmv.virginia.gov/commercial/#insurance/certifications.asp
- https://www.iii.org/article/background-on-insurance-fraud#_ftn1
- https://www.stampoutfraud.com/default.aspx
- https://virginialawfirm.net/police-radar-detectors-in-virginia.html
- https://www.dmv.virginia.gov/drivers/#reinstate.asp
- https://ucr.fbi.gov/crime-in-the-u.s/2013/crime-in-the-u.s.-2013/tables/table-8/table-8-state-cuts/table_8_offenses_known_to_law_enforcement_virginia_by_city_2013.xls
- https://www.nhtsa.gov/
Editorial Guidelines: We are a free online resource for anyone interested in learning more about auto insurance. Our goal is to be an objective, third-party resource for everything auto insurance related. We update our site regularly, and all content is reviewed by auto insurance experts.