Worst States for Traffic Fatalities in 2026 (Driving Risks & Rate Impact)
Texas, California, and Florida are the worst states for traffic fatalities, with Texas seeing 3,896 traffic deaths per year. Speeding, drunk driving, and distracted driving are leading causes of motor vehicle deaths. Read on to learn how these statistics affect auto insurance rates.
Read more Secured with SHA-256 Encryption


Find the Lowest Car Insurance Rates Today
Quote’s drivers have found rates as low as $42/month in the last few days!


Table of Contents
Table of Contents


Insurance and Finance Writer
Dorothea Hudson has been professionally writing in many spheres since 2013. She has written on entertainment, insurance, finance, travel, technology, AI, renewable energy, crypto, fundraising, and real estate for many websites. Her work has been published for British retailer Marks and Spencer, Kroger Magazine, the Vision Group, and more. Her passions include writing, music, running, travel, te...
Dorothea Hudson


Executive Chairman
Joel Ohman is the CEO of a private equity-backed digital media company. He is a published author, angel investor, and serial entrepreneur who has a passion for creating new things, from books to businesses. He has previously served as the founder and resident CFP® of a national insurance agency, Real Time Health Quotes. He has an MBA from the University of South Florida. Joel has been mentione...
Joel Ohman
Updated June 2025
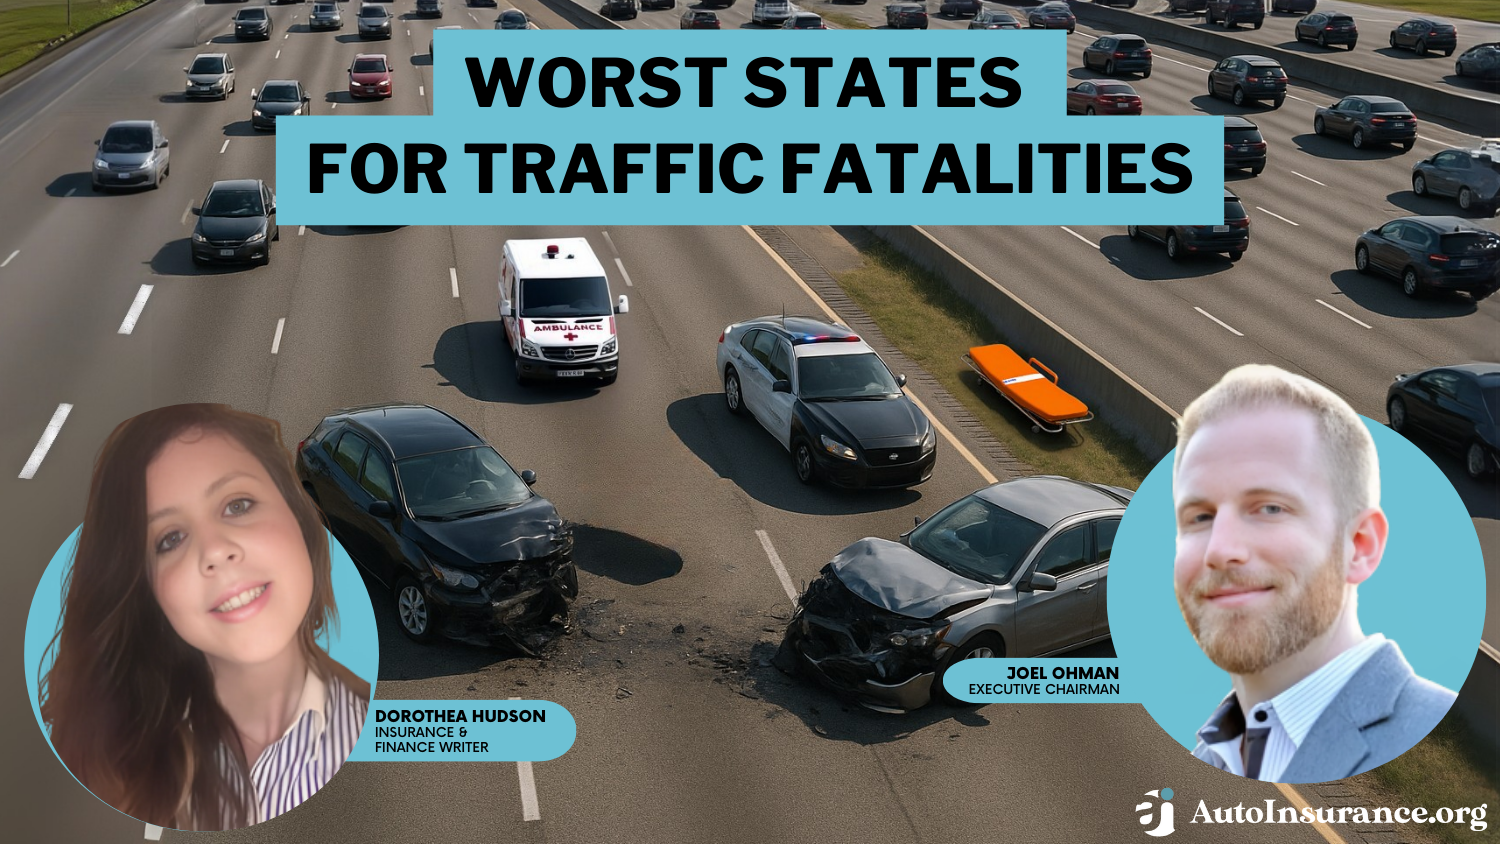
Despite advancements in vehicle safety technology, there are more than 35,000 people auto accident deaths every year, one of many factors that affect auto insurance rates.
So, where do the most car accidents happen in the U.S.?
The states with the most car accidents are Texas, California, and Florida. All three also rank among the deadliest states for pedestrians and bicyclists.
However, these states have some of the highest populations in the country. More people on the road increases the likelihood of an accident, but this doesn’t mean they are the worst states for driving.
Our study examines the leading cause of car accidents and vehicle deaths, as well as how fatal car crash statistics for your state impact the cost of auto insurance.
- Texas has the most car accidents, but Mississippi sees more traffic fatalities
- Speeding is the leading cause of traffic-related deaths in the U.S.
- Most fatal car accidents happen during the day in normal weather conditions
Safe drivers can earn discounts for keeping a clean driving record, which will help you save money on car insurance if you live in one of the top 10 states with the most fatal car accidents. Enter your ZIP code to instantly compare quotes from top providers.
Top 10 Worst States for Traffic Fatalities
Do you live in one of the most dangerous states for drivers in America? You might live in one of the worst states for drunk driving without knowing. Mississippi is the state with most fatal car accidents per 100,000 people, or the state with the most car accidents per capita.
10 Most Dangerous States for Drivers: Accident Stats
| Rank | State | Monthly Accidents | DUI Crashes | Speeding Crashes |
|---|---|---|---|---|
| #1 | Tennessee | 95 | 26% | 31% |
| #2 | South Carolina | 83 | 28% | 32% |
| #3 | Alabama | 78 | 30% | 33% |
| #4 | Louisiana | 61 | 30% | 33% |
| #5 | Kentucky | 61 | 20% | 25% |
| #6 | Mississippi | 53 | 26% | 30% |
| #7 | Arkansas | 42 | 25% | 28% |
| #8 | New Mexico | 35 | 31% | 34% |
| #9 | Montana | 15 | 36% | 35% |
| #10 | Wyoming | 12 | 25% | 30% |
At least 20 people per 100,000 died in traffic-related fatalities in Mississippi, Wyoming, Arkansas, and South Carolina. More than half of these fatal crash victims were drivers, but pedestrians and cyclists make up 10%-15% of car accident fatalities.
Both South Carolina and New Mexico were among the deadliest states with most auto accidents per capita in 2019.
10 Worst States for Pedestrian & Cyclist Traffic Fatalities: Annual Statistics
| Rank | State | Pedestrian Deaths | Cyclist Deaths |
|---|---|---|---|
| #1 | California | 972 | 133 |
| #2 | Florida | 713 | 161 |
| #3 | Texas | 649 | 66 |
| #4 | Arizona | 212 | 30 |
| #5 | South Carolina | 160 | 26 |
| #6 | Alabama | 119 | 6 |
| #7 | Louisiana | 118 | 22 |
| #8 | New Mexico | 83 | 9 |
| #9 | Hawaii | 36 | 4 |
| #10 | Delaware | 32 | 7 |
California, Florida, and Texas may have the highest number of pedestrian deaths, but New Mexico is the most dangerous state for pedestrians compared to its population size. In New Mexico, 20% of fatal accidents involve pedestrians.
Texas and California also have the most traffic deaths by state due to extremely large populations.
California has some of the worst traffic in the U.S., with frequent standstill traffic jams. This contributes to the state's high insurance rates.Brandon Frady Licensed Insurance Agent
Looking at traffic deaths by state, places such as Montana and Wyoming also top lists. These states have lesser populations but still have high automobile deaths per year due to rural roads. North Dakota and Wyoming also have high vehicle deaths per year. Drunk driving causes the worst traffic accidents in these areas.
Cyclists make up a small percentage of highway deaths — the national average is 2%. New Mexico is on par with the national average. However, in Florida, 5% of fatal accidents involve cyclists, and the average is 3% in Delaware.
State With the Most Fatal Car Accidents
Texas has the most deadly car accidents, with 3,615 traffic fatalities in 2019. California is a close second, with 3,606 traffic deaths. Since California is the most populous state in the country, followed by Texas, we examined the number of traffic fatalities per 100,000 people.
Our study shows Mississippi often leads in fatal crashes, with 25+ deaths per 100K. Over a quarter involve drunk driving, and nearly half occur on rural roads.
Leading Cause of Vehicle Deaths in the United States
More fatal accidents occur on roads with speed limits of 55 mph or higher. Speeding fatalities make up the majority of vehicular deaths per year. Speeding was the leading cause of fatal crashes in 2019 (17.2%), and nearly 19% of those drivers had prior convictions for speeding.
However, more than 15,000 traffic-related fatalities are caused by unknown factors, and more than half of fatal accidents involve good drivers with clean driving records.
Driving under the influence (10.1%) and failure to yield the right of way (7.3%) are the next major driving factors that lead to fatal accidents. Alcohol was involved in nearly a third of the traffic-related fatalities discussed above, and more than half of these accidents may have been avoided if the victims had been wearing seat belts.
Free Insurance Comparison
Compare Quotes From Top Companies and Save
Secured with SHA-256 Encryption
How Location Affects Auto Insurance Rates
Location is a significant factor in determining car insurance rates. Auto insurance companies consider traffic fatalities, commute times, and the auto theft rates in your city and state before issuing a policy.
The policy type and level of coverage you choose will also impact how much you pay. For example, each state requires minimum liability insurance, and these limits vary based on the number of accidents and uninsured motorists in your state.
Look at this table to compare average auto insurance rates by state.
Auto Insurance Monthly Rates by State & Coverage Level
| State | Minimum Coverage | Full Coverage |
|---|---|---|
| Alabama | $50 | $139 |
| Alaska | $50 | $147 |
| Arizona | $59 | $156 |
| Arkansas | $56 | $162 |
| California | $72 | $219 |
| Colorado | $51 | $169 |
| Connecticut | $87 | $169 |
| Delaware | $96 | $183 |
| Florida | $64 | $190 |
| Georgia | $72 | $179 |
| Hawaii | $37 | $100 |
| Idaho | $30 | $106 |
| Illinois | $57 | $150 |
| Indiana | $49 | $143 |
| Iowa | $26 | $104 |
| Kansas | $43 | $135 |
| Kentucky | $64 | $176 |
| Louisiana | $54 | $201 |
| Maine | $51 | $115 |
| Maryland | $126 | $237 |
| Massachusetts | $56 | $144 |
| Michigan | $163 | $339 |
| Minnesota | $90 | $220 |
| Mississippi | $53 | $142 |
| Missouri | $55 | $156 |
| Montana | $42 | $153 |
| Nebraska | $39 | $148 |
| Nevada | $61 | $144 |
| New Hampshire | $50 | $122 |
| New Jersey | $126 | $197 |
| New Mexico | $56 | $142 |
| New York | $90 | $174 |
| North Carolina | $55 | $131 |
| North Dakota | $49 | $177 |
| Ohio | $44 | $114 |
| Oklahoma | $52 | $160 |
| Oregon | $75 | $147 |
| Pennsylvania | $60 | $179 |
| Rhode Island | $61 | $143 |
| South Carolina | $79 | $191 |
| South Dakota | $20 | $127 |
| Tennessee | $37 | $130 |
| Texas | $77 | $207 |
| U.S. Average | $61 | $165 |
| Utah | $66 | $147 |
| Vermont | $43 | $133 |
| Virginia | $56 | $132 |
| Washington | $45 | $104 |
| Washington D.C. | $81 | $192 |
| West Virginia | $52 | $141 |
| Wisconsin | $47 | $133 |
| Wyoming | $24 | $105 |
You likely pay more for auto insurance if you live in a state with a higher number of car accidents. However, you can still get cheap auto insurance quotes if you maintain a good driving record, park your car in a garage, and install additional safety features in your vehicle.
Living in states with dangerous driving conditions typically cause higher insurance premiums. When looking into car accidents by state per capita, some states rank higher because of road conditions, driver behavior, and traffic volume.
Mississippi often ranks highest for traffic deaths, raising car insurance costs. Wyoming and South Carolina also have high accident rates.
When researching the state with most car crashes, Texas emerges at top. Other states with most car accidents include California and Florida. The accident rate by state shows that these states face high numbers of traffic incidents, driven by high population commuter traffic.
Ways Safe Drivers Can Save on Their Car Insurance
Insurance companies consider your driving record when calculating rates, and safe drivers pay less for car insurance because they are less likely to file a claim. For example, one car accident can raise your rates by $1,000 per year or more.
See how rates vary based on driving record in this table.
Auto Insurance Monthly Rates by Driving Record
| Insurance Company | Clean Record | One Ticket | One Accident | One DUI |
|---|---|---|---|---|
| $87 | $103 | $124 | $152 | |
 | $62 | $73 | $94 | $104 |
| $76 | $95 | $109 | $105 | |
| $43 | $56 | $71 | $117 | |
 | $96 | $116 | $129 | $178 |
 | $63 | $75 | $88 | $129 |
| $56 | $74 | $98 | $75 | |
| $47 | $53 | $57 | $65 | |
| $53 | $72 | $76 | $112 | |
| $32 | $36 | $42 | $58 |
Maintaining a good driving record can help you avoid higher rates in the future. Most insurers also offer discounts for safe drivers. Depending on where you buy auto insurance, you may be eligible to earn 5%-20% off your annual auto insurance rates.
Some drivers sign up for usage-based auto insurance and telematics programs to track their driving habits and earn discounts.
If your insurer doesn’t provide telematics technology, you can earn discounts by taking defensive driving courses that will teach you how to better anticipate other drivers’ behaviors on the road.
Most companies also reward drivers with reduced rates for remaining accident-free every year they renew.
Before you buy, remember you’ll find the cheapest auto insurance rates when you compare multiple companies online to find one that offers the safe driving discounts you need.
What You Need to Know About the Worst States for Traffic-Related Fatalities
The worst states for traffic fatalities are Mississippi, Wyoming, and Arkansas. In addition, more than half of the top 10 states with the most fatal car accidents are in the Southern region of the U.S., meaning car insurance rates are more expensive in these states.
Insurers consider local risk, like accident, theft, and fatality rates, when setting premiums, so drivers in states with high traffic fatalities pay more.Daniel S. Young Insurance Content Managing Editor
Maintaining a clean driving record is the easiest way to get cheap auto insurance rates in states with the most car accidents. For example, insurance companies will reward you with discounts if you take defensive driving courses and remain accident and claim-free during your annual policy.
However, you may have to shop for insurance with high-risk companies if you’ve been involved in an accident. Rates for high-risk auto insurance are more expensive, but you can still find a competitive price when you shop around online and compare auto insurance quotes from multiple companies.
When comparing the states with the most car accidents per capita, states like Louisiana, Mississippi, and South Carolina top the list. High accident rates cause more road fatalities by state. Car accident fatalities by state data show that South Carolina, Louisiana, and Mississippi suffer from a high number of traffic deaths compared to their populations.
Free Insurance Comparison
Compare Quotes From Top Companies and Save
Secured with SHA-256 Encryption
Methodology: How to Determine the Worst States for Traffic-Related Fatalities
We used the 2019 National Highway Transportation Safety Administration (NHTSA) FARS data to find the number of traffic fatalities per state. First, we considered how many auto deaths occurred per 100,000 persons to find an accurate representation based on each state’s population size.
In 2022, motorcyclists represented 15% of all traffic fatalities — the highest number of motorcyclists killed since at least 1975.
Drivers, look twice and save a life. 🏍️ pic.twitter.com/eRWrpkURYl
— nhtsagov (@NHTSAgov) May 28, 2024
On average, 11 per 100,000 people die in auto-related accidents in the U.S. The worst states have a significantly higher rate of death per 100,000, with Mississippi being the state with the most fatal car accidents per capita (25.4 per 100,000).
We also considered the percentage of drunk driving-related fatalities and seat belt usage to determine how many of these fatal accidents were caused by careless drivers. For pedestrians and cyclists, states were also ranked by the number of deaths per 100,000 to accurately represent population size.
Frequently Asked Questions
What states have the most car accidents per capita?
The states with the most traffic deaths are Texas, California, Florida, Georgia, and North Carolina, among others. Researching specific state per capita car accident statistic can be beneficial for those concerned about safety.
What are some common factors contributing to traffic-related fatalities?
Several factors can contribute to traffic-related fatalities, including speeding, distracted driving (e.g., texting while driving), drunk driving, failure to use seat belts, reckless driving, poor road conditions, and inadequate infrastructure. These factors, when combined with other variables, can increase the likelihood of fatal accidents.
Are there any initiatives or programs aimed at reducing traffic-related fatalities?
Yes, various initiatives and programs are implemented at the state and national levels to reduce traffic-related fatalities. These may include campaigns promoting safe driving practices, stricter enforcement of traffic laws, educational programs for drivers and pedestrians, improved road infrastructure, and the development of advanced vehicle safety technologies.
What can individuals do to help prevent traffic-related fatalities?
Individuals can play an important role in preventing traffic-related fatalities. Some measures they can take include obeying traffic laws, avoiding distractions while driving (such as mobile phone use), wearing seat belts at all times, driving sober, maintaining their vehicles in proper condition, being mindful of pedestrians and cyclists, and staying updated on safe driving practices.
How can insurance coverage help in the event of a traffic-related fatality?
Insurance coverage can provide financial support in the aftermath of a traffic-related fatality. Depending on the policy, it may offer benefits such as death benefits to the family of the deceased, coverage for medical expenses incurred as a result of the accident, and liability coverage to protect the insured driver from potential lawsuits arising from the incident.
What state has the most fatal car accidents per capita?
The state with highest traffic fatalities is typically Texas, with the deadliest month on Texas roadways being the month of August. Holiday travel and hot weather in Texas lead to August having the most auto related deaths per year. Texas frequently has the most traffic deaths because of high populations traveling on extensive roadways.
However, Alabama and Montana have significant car accident deaths by state. This makes them some of the worst states for car accidents to live in. Car accidents can happen easily on long rural roads. This is due to typically higher speed limits, and less access to emergency medical services, all of which contribute to traffic deaths per year.
Which state has the most traffic fatalities?
When researching the highest traffic fatalities by state, Texas comes out on top. This means Texas is the state with most traffic accidents resulting in deaths. Many things contribute towards Texas having the most auto deaths per year, such as the long distance between larger cities, highway congestion, and many rural roads.
How many people die in road accidents in the USA per year?
In the United States of America, approximately 40,000 highway deaths per year occur, according to the National Highway Traffic Safety Administration. The number of car accident deaths per year is usually between 35,000 and 45,000, but can vary.
Which state has the highest fatal car accident rate?
Texas has the most deadly car accidents, with 3,615 traffic-related fatalities in 2019. California is a close second state with the most traffic deaths, with 3,606.
What is the leading cause of vehicle deaths in the United States?
Speeding fatalities make up most vehicle deaths each year. More fatal accidents occur on roads with speed limits of 55 mph or higher.
Does location affect auto insurance rates?
Do safe drivers get cheap auto insurance rates?
Get a FREE Quote in Minutes
Insurance rates change constantly — we help you stay ahead by making it easy to compare top options and save.


